
- Home >
- Stock Photos >
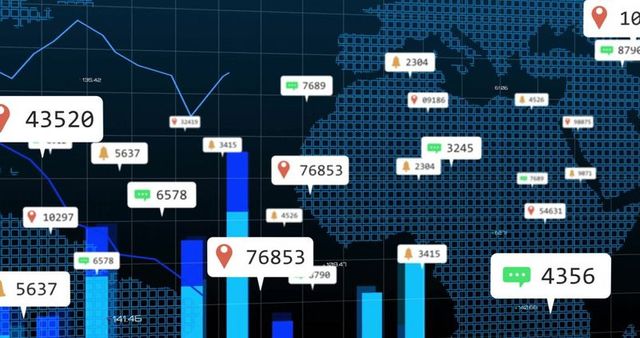
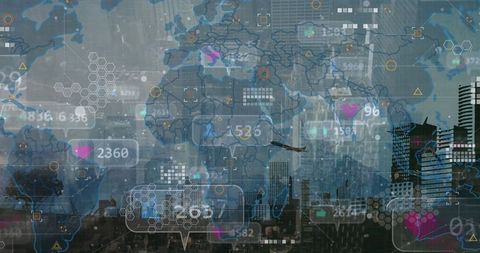
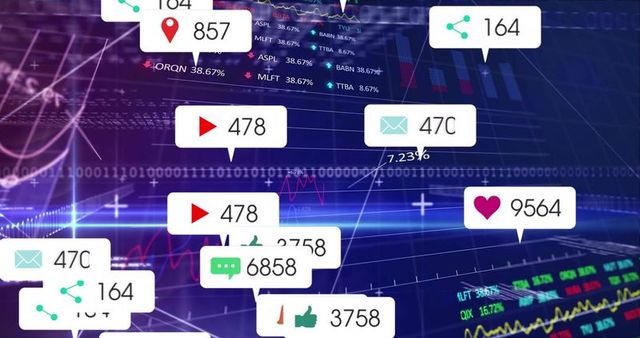
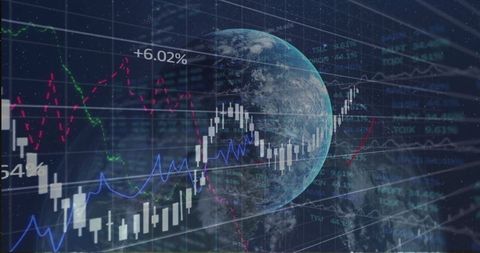
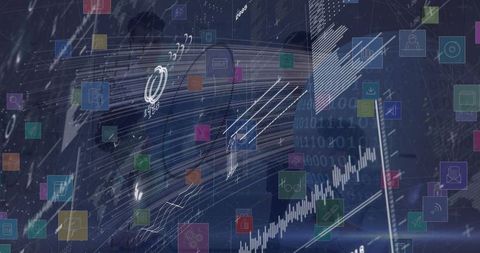
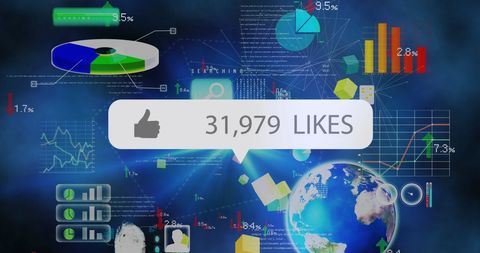
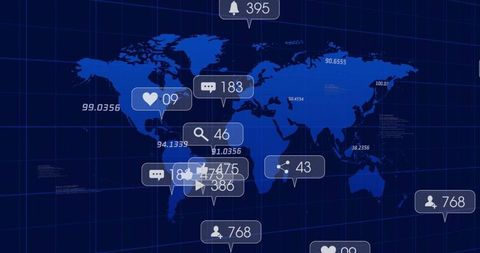
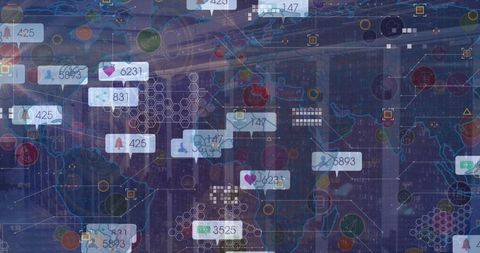
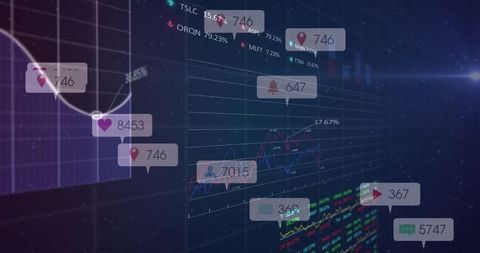
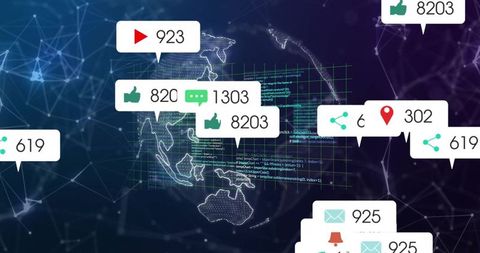
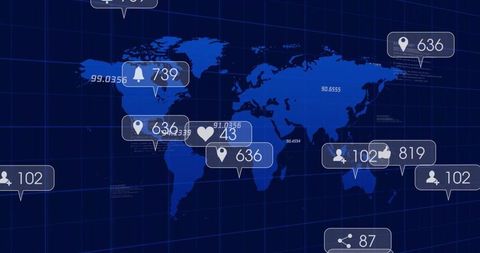
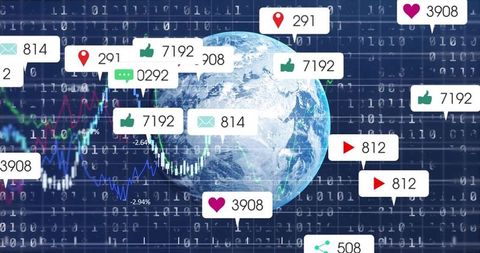
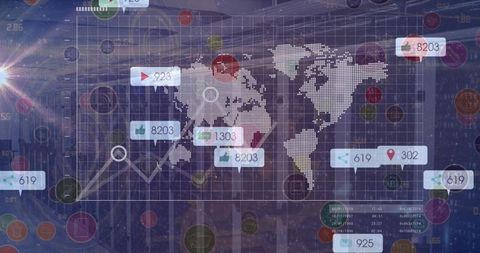
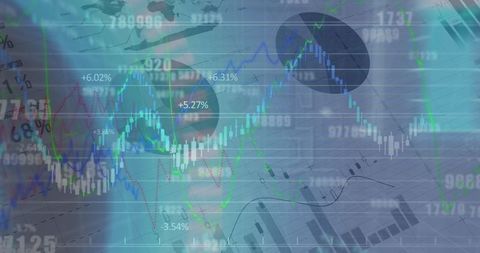
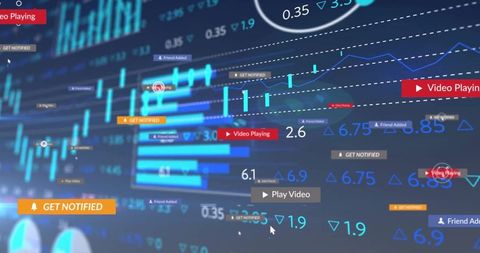
- Global Financial Data Visualization with Interactive Dashboard Elements
Global Financial Data Visualization with Interactive Dashboard Elements Image
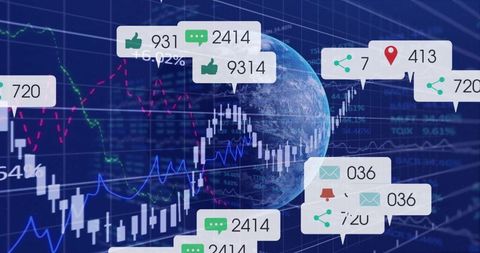
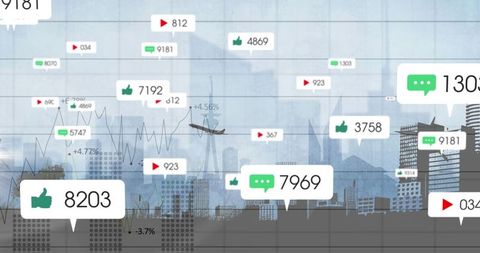
Depiction of financial trading data with a digital interface incorporating elements like candlestick charts and analytic trend lines against a background of a 3D globe. Interactive callouts including likes, messages, and notifications suggest engagement with a digital trading platform. Useful for illustrating concepts in global finance, digital trading tools, and analytical dashboards in presentations or marketing materials.
Powered by  - Get 15% off with code: PIKWIZARD15


downloads
Tags:
More
Credit Photo
If you would like to credit the Photo, here are some ways you can do so
Text Link
photo Link
<span class="text-link">
<span>
<a target="_blank" href=https://pikwizard.com/photo/global-financial-data-visualization-with-interactive-dashboard-elements/7e332d4f322eb9eeed69bccbd0a3df5a/>PikWizard</a>
</span>
</span>
<span class="image-link">
<span
style="margin: 0 0 20px 0; display: inline-block; vertical-align: middle; width: 100%;"
>
<a
target="_blank"
href="https://pikwizard.com/photo/global-financial-data-visualization-with-interactive-dashboard-elements/7e332d4f322eb9eeed69bccbd0a3df5a/"
style="text-decoration: none; font-size: 10px; margin: 0;"
>
<img src="https://pikwizard.com/pw/medium/7e332d4f322eb9eeed69bccbd0a3df5a.jpg" style="margin: 0; width: 100%;" alt="" />
<p style="font-size: 12px; margin: 0;">PikWizard</p>
</a>
</span>
</span>
Free (free of charge)
Free for personal and commercial use.
Author: Awesome Content
Similar Free Stock Images

Premium

Premium


Premium


Premium


Premium


Premium

Premium


Premium


Premium

Premium


Premium


Premium


Premium


Premium


Premium


Premium

Premium


Premium


Premium

Premium


Premium

Premium


Premium


Premium


Premium

Explore More Free Stock Images