- Home >
- Stock Photos >
- Global Financial Data Visualization with Interactive Map and Charts
Global Financial Data Visualization with Interactive Map and Charts Image

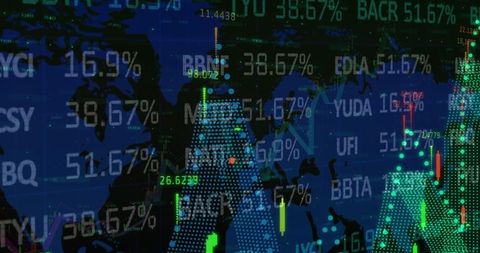
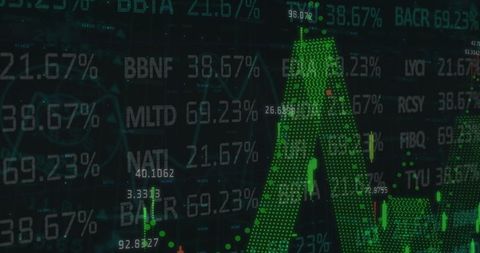
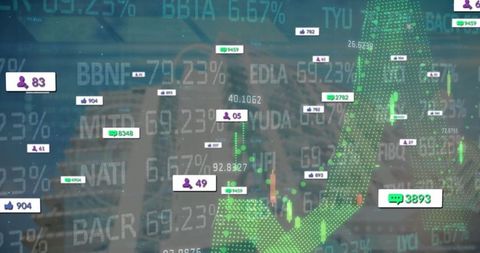
The image features a dotted world map overlaying a backdrop of financial data, showcasing percentages, numeric details, and candlestick charts. It highlights a futuristic approach to international finance with its technology-driven visualization and analytics tools. Ideal for use in presentations about global markets, investment strategy reports, and educational materials on financial market analysis.

downloads
Tags:
More
Credit Photo
If you would like to credit the Photo, here are some ways you can do so
Text Link
photo Link
<span class="text-link">
<span>
<a target="_blank" href=https://pikwizard.com/photo/global-financial-data-visualization-with-interactive-map-and-charts/00e5ac3d5b38e4280550cb65045178d9/>PikWizard</a>
</span>
</span>
<span class="image-link">
<span
style="margin: 0 0 20px 0; display: inline-block; vertical-align: middle; width: 100%;"
>
<a
target="_blank"
href="https://pikwizard.com/photo/global-financial-data-visualization-with-interactive-map-and-charts/00e5ac3d5b38e4280550cb65045178d9/"
style="text-decoration: none; font-size: 10px; margin: 0;"
>
<img src="https://pikwizard.com/pw/medium/00e5ac3d5b38e4280550cb65045178d9.jpg" style="margin: 0; width: 100%;" alt="" />
<p style="font-size: 12px; margin: 0;">PikWizard</p>
</a>
</span>
</span>
Free (free of charge)
Free for personal and commercial use.
Author: Awesome Content