- Home >
- Stock Photos >
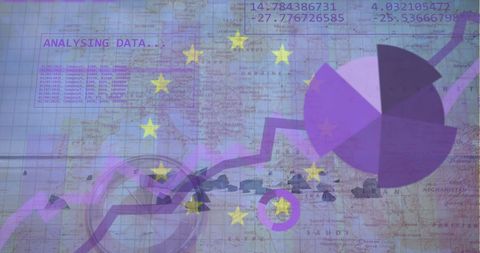
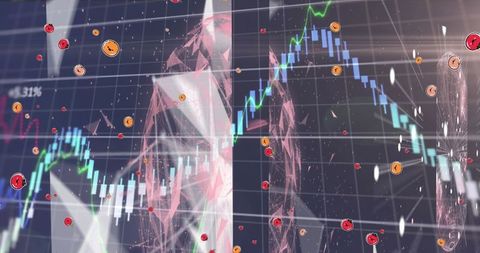
- Global Financial Data Visualization with Red Bar Graph and World Map
Global Financial Data Visualization with Red Bar Graph and World Map Image

This abstract image showcases global financial data processing with a red bar graph overlaid on a world map, embodying themes of international business and data analytics. Floating symbols and lines add a technological feel. Ideal for use in financial reports, corporate presentations, and articles discussing global economics, financial markets, or digital innovations in finance.

downloads
Tags:
More
Credit Photo
If you would like to credit the Photo, here are some ways you can do so
Text Link
photo Link
<span class="text-link">
<span>
<a target="_blank" href=https://pikwizard.com/photo/global-financial-data-visualization-with-red-bar-graph-and-world-map/c136a0f2e1e00a21d0e1dfe5ce7dbf70/>PikWizard</a>
</span>
</span>
<span class="image-link">
<span
style="margin: 0 0 20px 0; display: inline-block; vertical-align: middle; width: 100%;"
>
<a
target="_blank"
href="https://pikwizard.com/photo/global-financial-data-visualization-with-red-bar-graph-and-world-map/c136a0f2e1e00a21d0e1dfe5ce7dbf70/"
style="text-decoration: none; font-size: 10px; margin: 0;"
>
<img src="https://pikwizard.com/pw/medium/c136a0f2e1e00a21d0e1dfe5ce7dbf70.jpg" style="margin: 0; width: 100%;" alt="" />
<p style="font-size: 12px; margin: 0;">PikWizard</p>
</a>
</span>
</span>
Free (free of charge)
Free for personal and commercial use.
Author: Authentic Images