
- Home >
- Stock Photos >
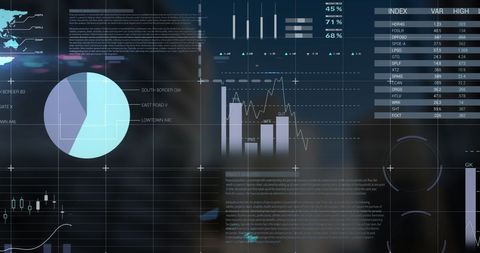
- Global Financial Data Visualization with Statistics and Charts
Global Financial Data Visualization with Statistics and Charts Image

This detailed illustration shows a digital overlay of various statistical elements such as maps, pie charts, and line graphs. Useful for presentations, infographics, and reports on global financial trends, data analysis, or business strategies. Ideal for financial services, technology driven firms, or educational purposes regarding data sciences.
Powered by  - Get 15% off with code: PIKWIZARD15


downloads
Tags:
More
Credit Photo
If you would like to credit the Photo, here are some ways you can do so
Text Link
photo Link
<span class="text-link">
<span>
<a target="_blank" href=https://pikwizard.com/photo/global-financial-data-visualization-with-statistics-and-charts/cbf1fffd7191bb688455c99ddbb261cb/>PikWizard</a>
</span>
</span>
<span class="image-link">
<span
style="margin: 0 0 20px 0; display: inline-block; vertical-align: middle; width: 100%;"
>
<a
target="_blank"
href="https://pikwizard.com/photo/global-financial-data-visualization-with-statistics-and-charts/cbf1fffd7191bb688455c99ddbb261cb/"
style="text-decoration: none; font-size: 10px; margin: 0;"
>
<img src="https://pikwizard.com/pw/medium/cbf1fffd7191bb688455c99ddbb261cb.jpg" style="margin: 0; width: 100%;" alt="" />
<p style="font-size: 12px; margin: 0;">PikWizard</p>
</a>
</span>
</span>
Free (free of charge)
Free for personal and commercial use.
Author: Awesome Content
Similar Free Stock Images

Premium


Premium


Premium


Premium


Premium


Premium


Premium

Premium


Premium


Premium

Premium


Premium


Premium

Premium


Premium


Premium

Premium


Premium


Premium


Premium


Premium


Premium


Premium


Premium


Premium

Explore More Free Stock Images