- Home >
- Stock Photos >
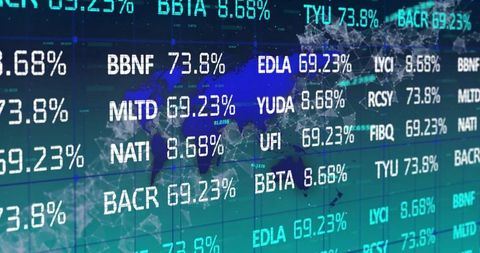
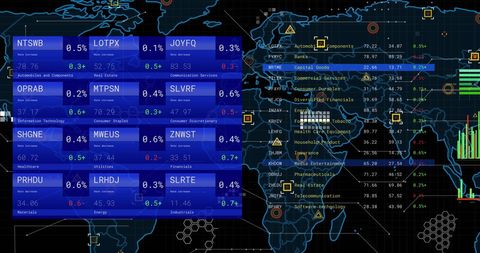
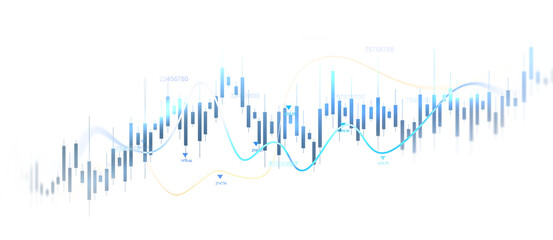
- Global Financial Data Visualization with Stock Market Chart
Global Financial Data Visualization with Stock Market Chart Image

Visual representation of financial data on a digital screen with a focus on stock market trends and global economic information. Useful for illustrating stock market analysis, economic trends, and financial technology integration in presentations or articles related to global finance.
Powered by 


downloads
Tags:
More
Credit Photo
If you would like to credit the Photo, here are some ways you can do so
Text Link
photo Link
<span class="text-link">
<span>
<a target="_blank" href=https://pikwizard.com/photo/global-financial-data-visualization-with-stock-market-chart/991360440f9e8c49f888d95897e1105a/>PikWizard</a>
</span>
</span>
<span class="image-link">
<span
style="margin: 0 0 20px 0; display: inline-block; vertical-align: middle; width: 100%;"
>
<a
target="_blank"
href="https://pikwizard.com/photo/global-financial-data-visualization-with-stock-market-chart/991360440f9e8c49f888d95897e1105a/"
style="text-decoration: none; font-size: 10px; margin: 0;"
>
<img src="https://pikwizard.com/pw/medium/991360440f9e8c49f888d95897e1105a.jpg" style="margin: 0; width: 100%;" alt="" />
<p style="font-size: 12px; margin: 0;">PikWizard</p>
</a>
</span>
</span>
Free (free of charge)
Free for personal and commercial use.
Author: Awesome Content
Similar Free Stock Images
Loading...

Premium


Premium

Premium


Premium


Premium


Premium


Premium


Premium


Premium


Premium


Premium


Premium


Premium


Premium


Premium


Premium


Premium


Premium


Premium


Premium

Premium


Premium


Premium


Premium


Premium