- Home >
- Stock Photos >
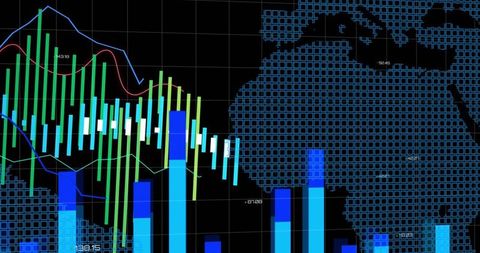
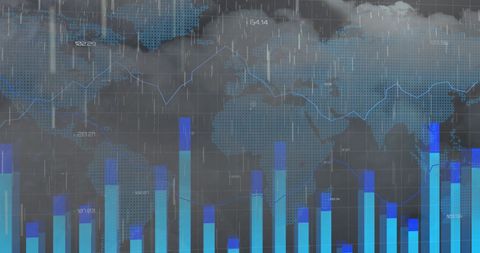
- Global Financial Data Visualization with World Map and Graphs
Global Financial Data Visualization with World Map and Graphs Image

Digital representation of global finance and economic data with abstract graphs overlaying world map. Useful for illustrating concepts related to global financial markets, economic analysis, statistical data trends, and business growth visuals in presentations or websites focused on financial services.

downloads
Tags:
More
Credit Photo
If you would like to credit the Photo, here are some ways you can do so
Text Link
photo Link
<span class="text-link">
<span>
<a target="_blank" href=https://pikwizard.com/photo/global-financial-data-visualization-with-world-map-and-graphs/504a5a95069dfab58a26806d2c9e8124/>PikWizard</a>
</span>
</span>
<span class="image-link">
<span
style="margin: 0 0 20px 0; display: inline-block; vertical-align: middle; width: 100%;"
>
<a
target="_blank"
href="https://pikwizard.com/photo/global-financial-data-visualization-with-world-map-and-graphs/504a5a95069dfab58a26806d2c9e8124/"
style="text-decoration: none; font-size: 10px; margin: 0;"
>
<img src="https://pikwizard.com/pw/medium/504a5a95069dfab58a26806d2c9e8124.jpg" style="margin: 0; width: 100%;" alt="" />
<p style="font-size: 12px; margin: 0;">PikWizard</p>
</a>
</span>
</span>
Free (free of charge)
Free for personal and commercial use.
Author: Awesome Content