- Home >
- Stock Photos >
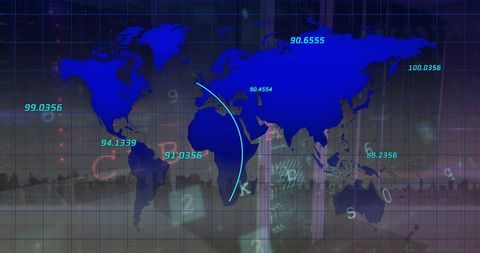
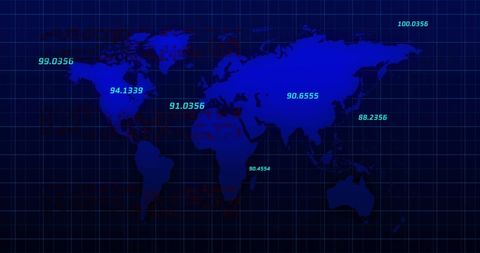
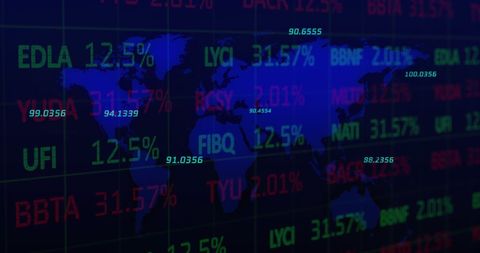
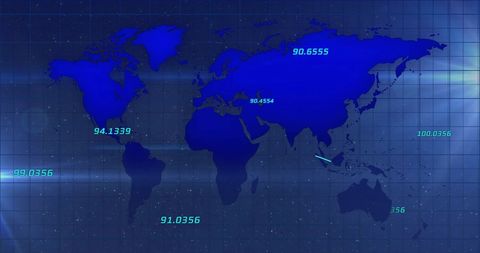
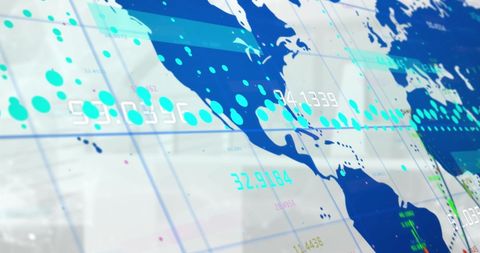
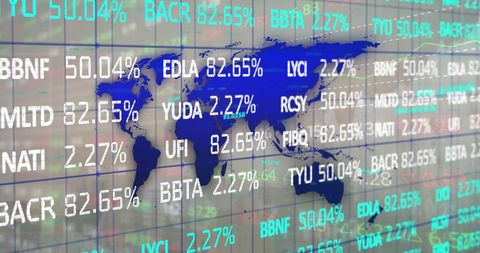
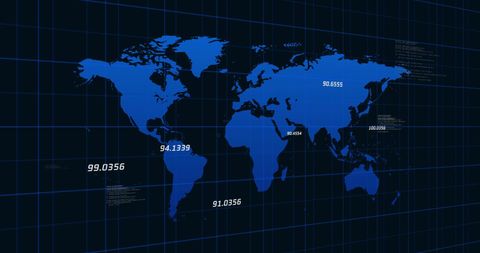
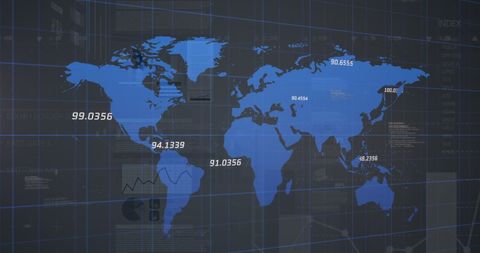
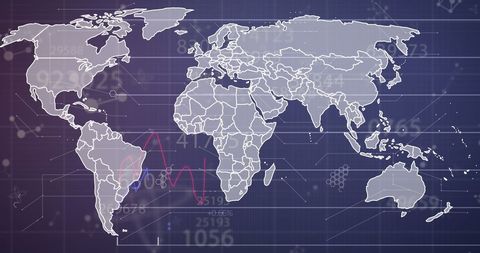
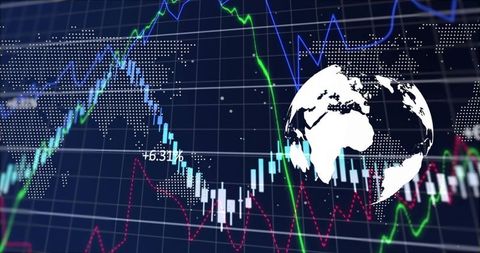
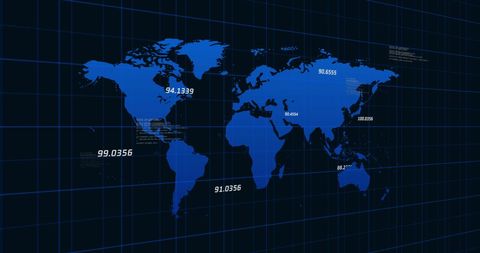
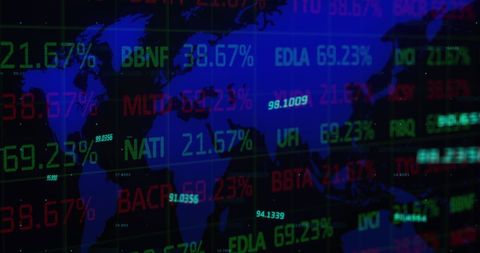
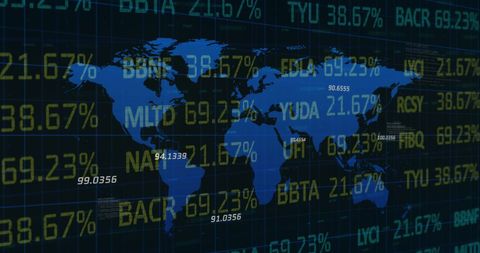
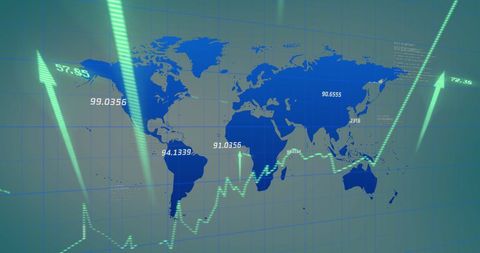
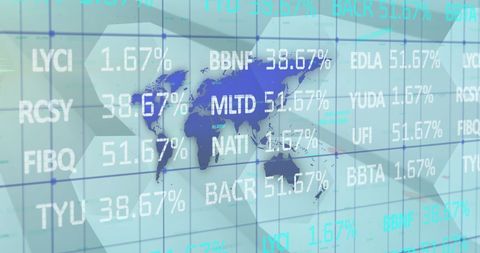
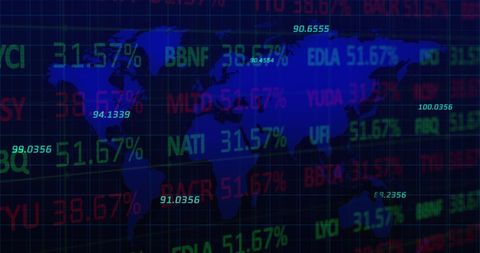
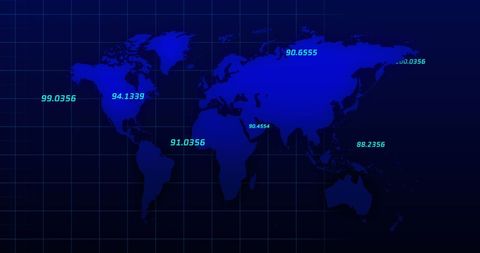
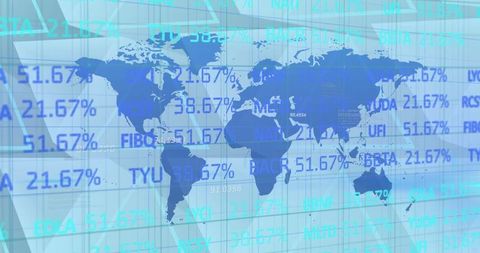
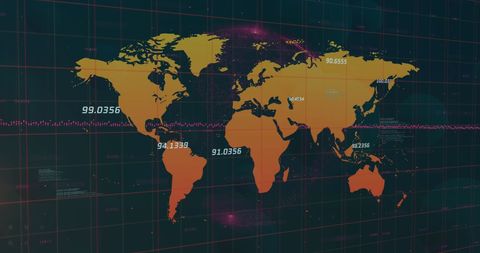
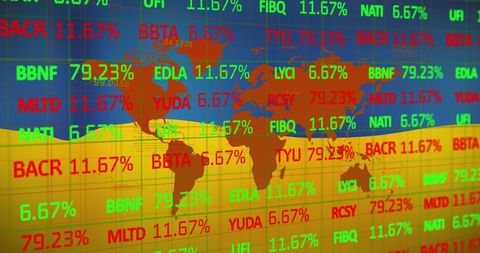
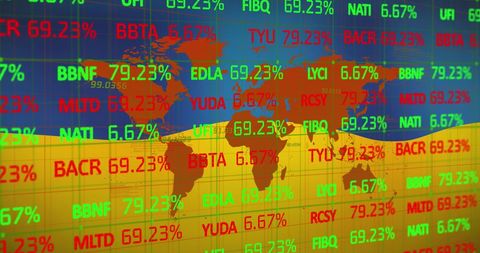
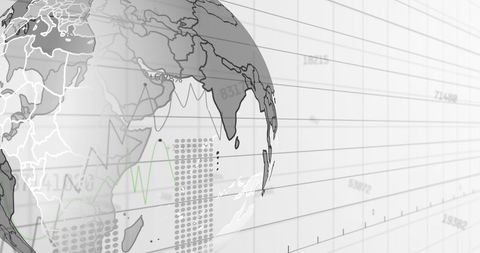
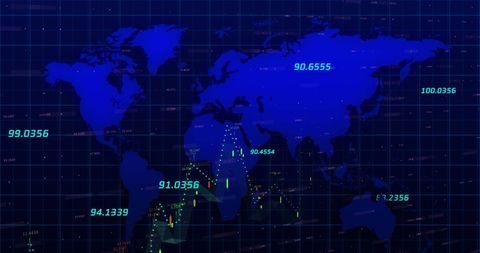
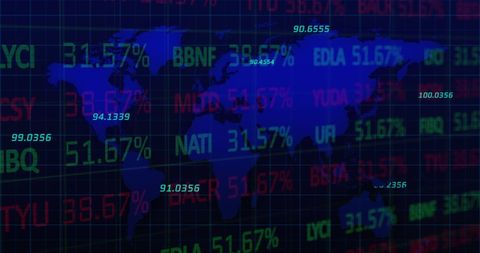
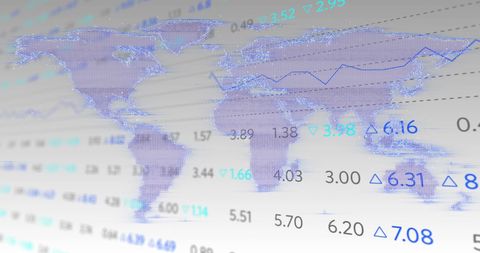
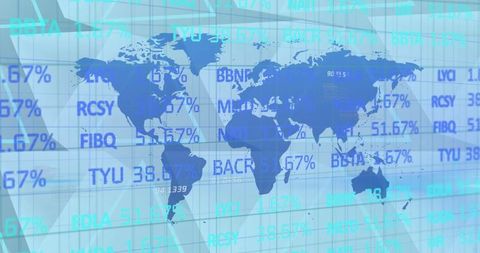
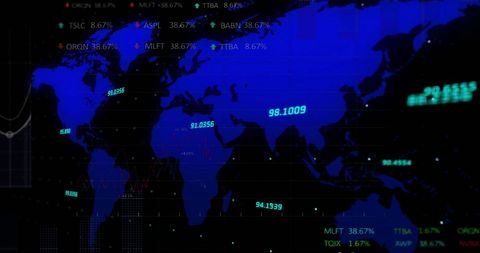
- Global Financial Data Visualization with World Map Interface
Global Financial Data Visualization with World Map Interface Image
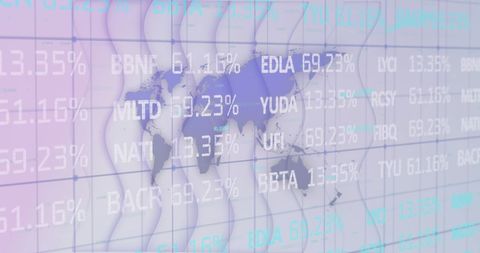
This futuristic digital interface displays financial data over a world map, ideal for illustrating global finance and market analysis concepts. It can be used in presentations, financial reports, and technology articles to demonstrate the integration of global economic data and trends through innovative visual technology applications.

downloads
Tags:
More
Credit Photo
If you would like to credit the Photo, here are some ways you can do so
Text Link
photo Link
<span class="text-link">
<span>
<a target="_blank" href=https://pikwizard.com/photo/global-financial-data-visualization-with-world-map-interface/25ef76f1aa9ca21a7b018f77cf5a7e4f/>PikWizard</a>
</span>
</span>
<span class="image-link">
<span
style="margin: 0 0 20px 0; display: inline-block; vertical-align: middle; width: 100%;"
>
<a
target="_blank"
href="https://pikwizard.com/photo/global-financial-data-visualization-with-world-map-interface/25ef76f1aa9ca21a7b018f77cf5a7e4f/"
style="text-decoration: none; font-size: 10px; margin: 0;"
>
<img src="https://pikwizard.com/pw/medium/25ef76f1aa9ca21a7b018f77cf5a7e4f.jpg" style="margin: 0; width: 100%;" alt="" />
<p style="font-size: 12px; margin: 0;">PikWizard</p>
</a>
</span>
</span>
Free (free of charge)
Free for personal and commercial use.
Author: Awesome Content