- Home >
- Stock Photos >
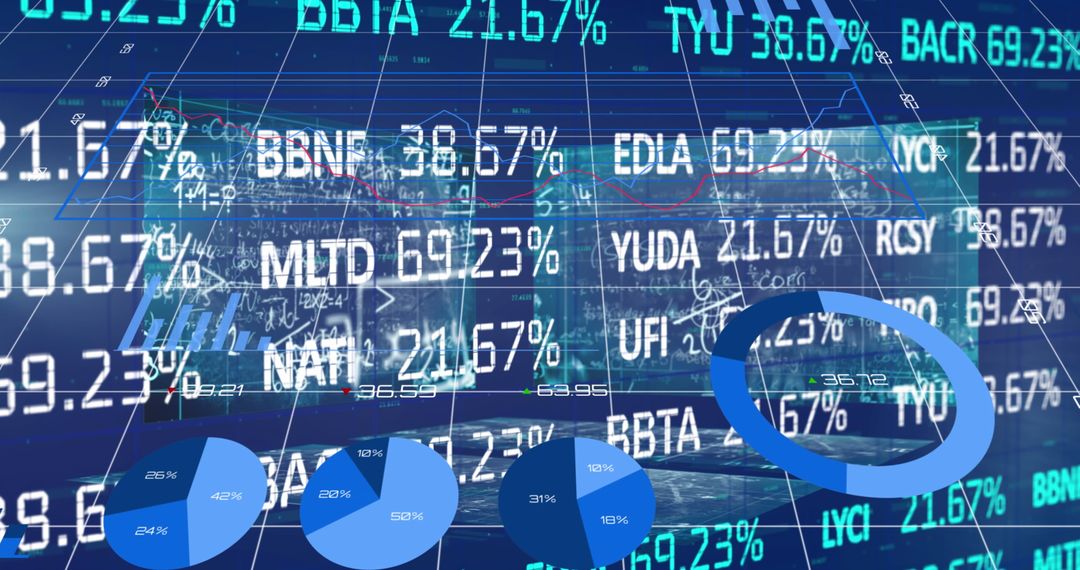
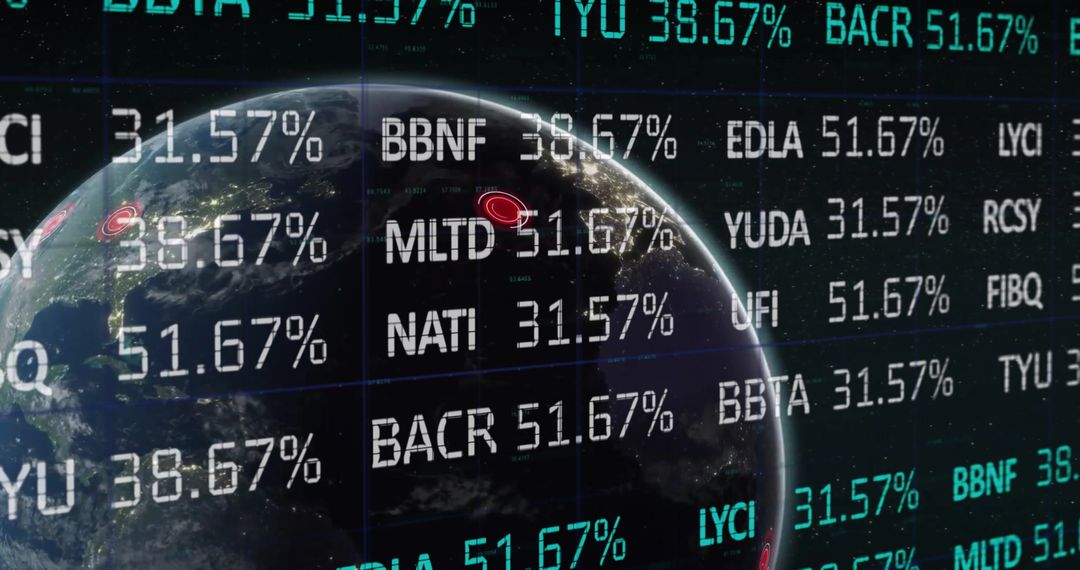
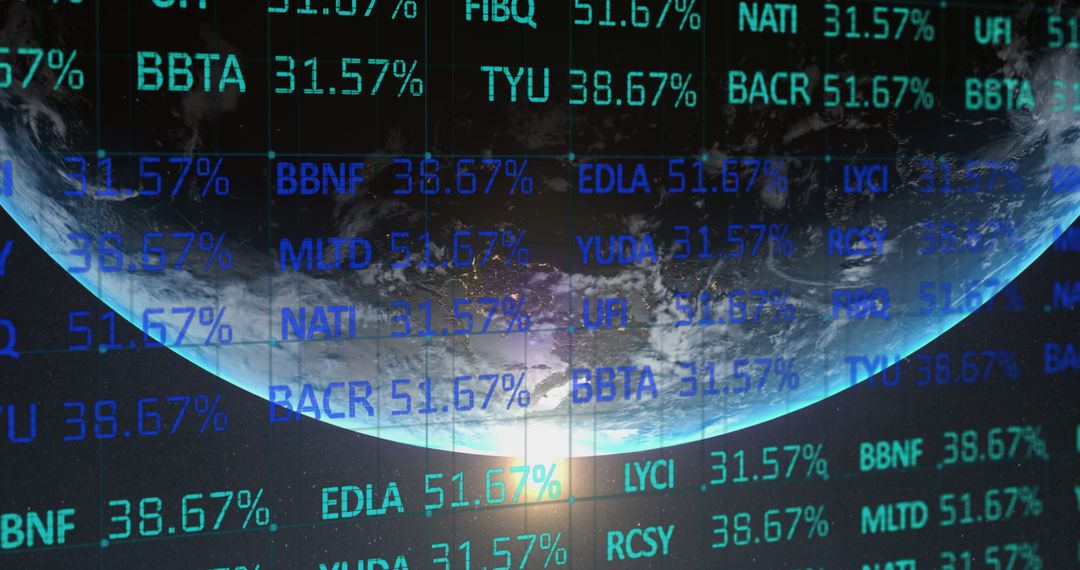
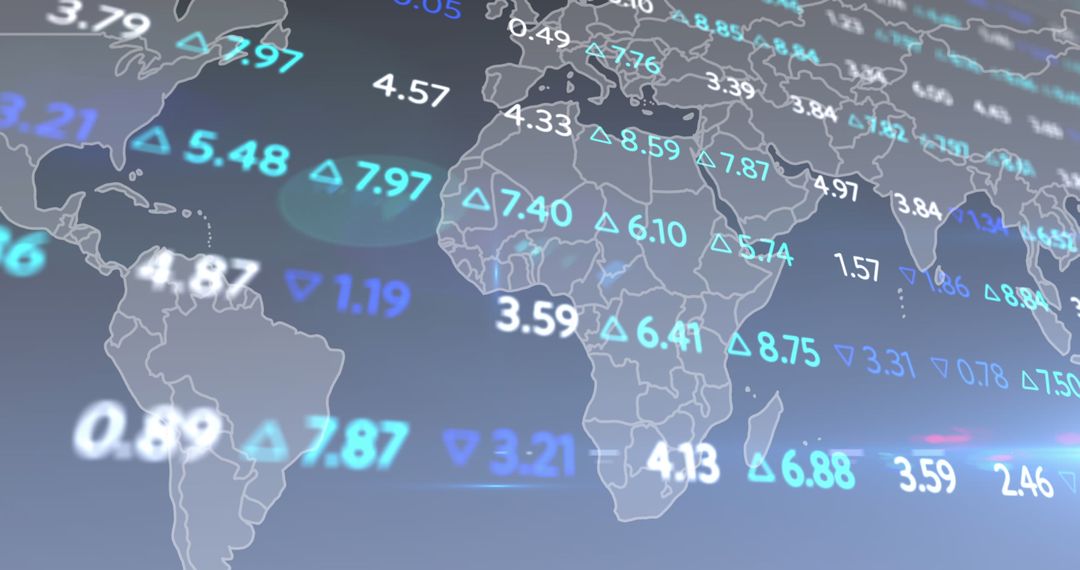
- Global Financial Data Visualized in Abstract Graphic
Global Financial Data Visualized in Abstract Graphic Image

This abstract graphic combines elements of digital data processing with an image of a globe, representing global finance and economic trends. The overlay of stock market information symbolizes interconnected markets and investment strategies relevant today. This visualization can be used in presentations about global business, in financial technology materials, or on websites about economy and international trade.
Powered by 


2
downloads
downloads
Tags:
More
Credit Photo
If you would like to credit the Photo, here are some ways you can do so
Text Link
photo Link
<span class="text-link">
<span>
<a target="_blank" href=https://pikwizard.com/photo/global-financial-data-visualized-in-abstract-graphic/ead6b3e67284705510ff453e7abfd559/>PikWizard</a>
</span>
</span>
<span class="image-link">
<span
style="margin: 0 0 20px 0; display: inline-block; vertical-align: middle; width: 100%;"
>
<a
target="_blank"
href="https://pikwizard.com/photo/global-financial-data-visualized-in-abstract-graphic/ead6b3e67284705510ff453e7abfd559/"
style="text-decoration: none; font-size: 10px; margin: 0;"
>
<img src="https://pikwizard.com/pw/medium/ead6b3e67284705510ff453e7abfd559.jpg" style="margin: 0; width: 100%;" alt="" />
<p style="font-size: 12px; margin: 0;">PikWizard</p>
</a>
</span>
</span>
Free (free of charge)
Free for personal and commercial use.
Author: Authentic Images
Similar Free Stock Images

Premium


Premium


Premium


Premium


Premium


Premium


Premium


Premium


Premium


Premium


Premium


Premium


Premium


Premium


Premium


Premium


Premium


Premium


Premium


Premium


Premium


Premium


Premium


Premium