
- Home >
- Stock Photos >
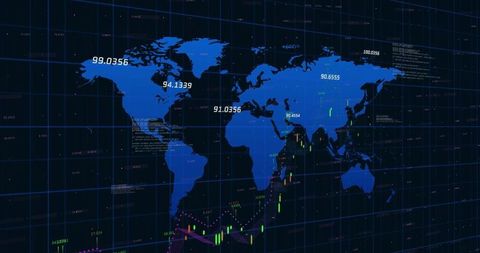
- Global Financial Data with Analytics Overlay Concept
Global Financial Data with Analytics Overlay Concept Image

Displays interplay of global finance and technology through candlestick and line graphs with earth in background. Social media icons overlaid emphasize interconnected worlds of finance and digital interaction. Useful for illustrating concepts in global economy, technological innovations in finance, or social media impact on investments.
Powered by 


downloads
Tags:
More
Credit Photo
If you would like to credit the Photo, here are some ways you can do so
Text Link
photo Link
<span class="text-link">
<span>
<a target="_blank" href=https://pikwizard.com/photo/global-financial-data-with-analytics-overlay-concept/519a6b79039fd79fcc2e408e6a0fc44a/>PikWizard</a>
</span>
</span>
<span class="image-link">
<span
style="margin: 0 0 20px 0; display: inline-block; vertical-align: middle; width: 100%;"
>
<a
target="_blank"
href="https://pikwizard.com/photo/global-financial-data-with-analytics-overlay-concept/519a6b79039fd79fcc2e408e6a0fc44a/"
style="text-decoration: none; font-size: 10px; margin: 0;"
>
<img src="https://pikwizard.com/pw/medium/519a6b79039fd79fcc2e408e6a0fc44a.jpg" style="margin: 0; width: 100%;" alt="" />
<p style="font-size: 12px; margin: 0;">PikWizard</p>
</a>
</span>
</span>
Free (free of charge)
Free for personal and commercial use.
Author: Awesome Content
Similar Free Stock Images

Premium


Premium

Premium


Premium


Premium


Premium


Premium


Premium

Premium


Premium


Premium


Premium


Premium


Premium


Premium


Premium


Premium


Premium


Premium


Premium


Premium


Premium

Premium


Premium

Premium


Explore More Free Stock Images