- Home >
- Stock Photos >
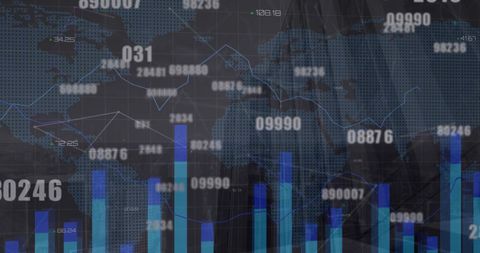
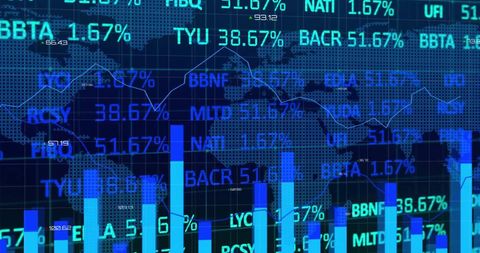
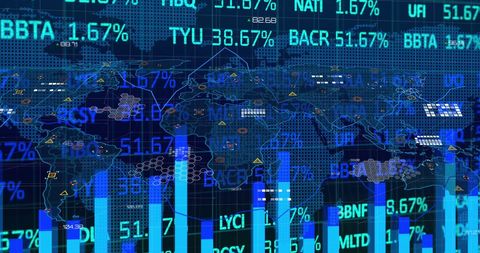
- Global Financial Data with Bar Graphs and Map
Global Financial Data with Bar Graphs and Map Image
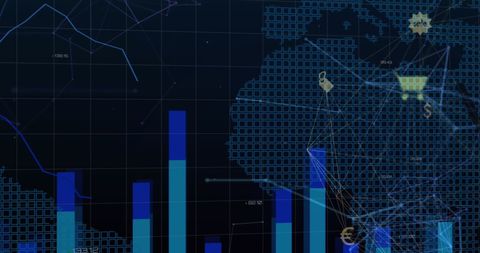
Showing bar graphs and a world map overlay, this image depicts financial data visualization accented with abstract digital and technological elements. Ideal for presentations related to global trade analysis, economic forecasting, fintech development, and international market trends.
Powered by 


2
downloads
downloads
Tags:
More
Credit Photo
If you would like to credit the Photo, here are some ways you can do so
Text Link
photo Link
<span class="text-link">
<span>
<a target="_blank" href=https://pikwizard.com/photo/global-financial-data-with-bar-graphs-and-map/0b275acf5e01b7716838352b3c2fe22d/>PikWizard</a>
</span>
</span>
<span class="image-link">
<span
style="margin: 0 0 20px 0; display: inline-block; vertical-align: middle; width: 100%;"
>
<a
target="_blank"
href="https://pikwizard.com/photo/global-financial-data-with-bar-graphs-and-map/0b275acf5e01b7716838352b3c2fe22d/"
style="text-decoration: none; font-size: 10px; margin: 0;"
>
<img src="https://pikwizard.com/pw/medium/0b275acf5e01b7716838352b3c2fe22d.jpg" style="margin: 0; width: 100%;" alt="" />
<p style="font-size: 12px; margin: 0;">PikWizard</p>
</a>
</span>
</span>
Free (free of charge)
Free for personal and commercial use.
Author: People Creations
Similar Free Stock Images

Premium


Premium


Premium


Premium


Premium


Premium


Premium


Premium


Premium


Premium


Premium


Premium


Premium


Premium


Premium


Premium


Premium


Premium


Premium


Premium


Premium


Premium


Premium


Premium


Premium