- Home >
- Stock Photos >
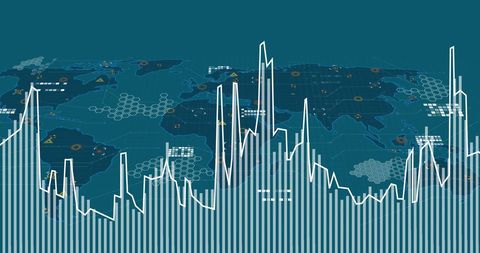
- Global Financial Data with Digital Graph on World Map
Global Financial Data with Digital Graph on World Map Image

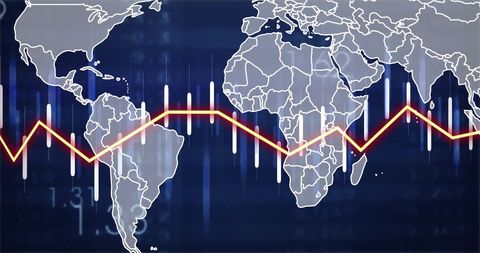
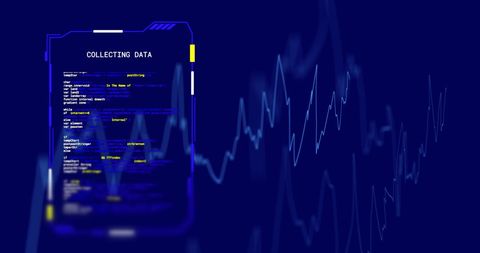
Abstract representation of global financial data processing depicted with a digital graph overlaying a world map. Ideal for articles or presentations regarding global economics, financial technology advancements, and data analysis trends. Perfect visual resource for businesses focused on international markets or technology industries.

downloads
Tags:
More
Credit Photo
If you would like to credit the Photo, here are some ways you can do so
Text Link
photo Link
<span class="text-link">
<span>
<a target="_blank" href=https://pikwizard.com/photo/global-financial-data-with-digital-graph-on-world-map/bc5e5e67499251636f2eb050ec7d65f7/>PikWizard</a>
</span>
</span>
<span class="image-link">
<span
style="margin: 0 0 20px 0; display: inline-block; vertical-align: middle; width: 100%;"
>
<a
target="_blank"
href="https://pikwizard.com/photo/global-financial-data-with-digital-graph-on-world-map/bc5e5e67499251636f2eb050ec7d65f7/"
style="text-decoration: none; font-size: 10px; margin: 0;"
>
<img src="https://pikwizard.com/pw/medium/bc5e5e67499251636f2eb050ec7d65f7.jpg" style="margin: 0; width: 100%;" alt="" />
<p style="font-size: 12px; margin: 0;">PikWizard</p>
</a>
</span>
</span>
Free (free of charge)
Free for personal and commercial use.
Author: Creative Art