
- Home >
- Stock Photos >
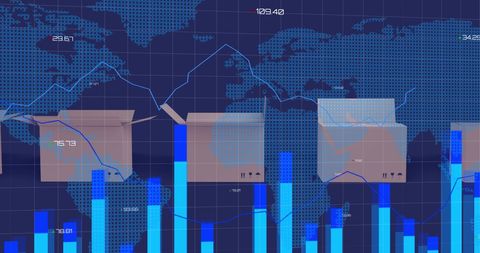
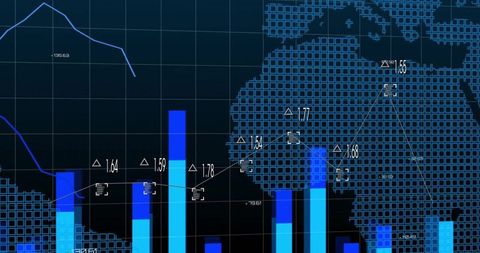
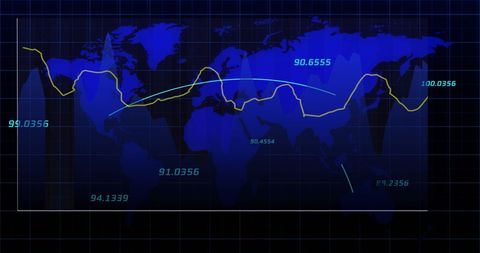
- Global Financial Data with Graphs and World Map Visualization
Global Financial Data with Graphs and World Map Visualization Image

Illustrating global financial data trends with numbers and graphical elements overlaid on a world map. Ideal for business reports, presentations, and educational materials focusing on international economics and stock market analysis.
Powered by 


downloads
Tags:
More
Credit Photo
If you would like to credit the Photo, here are some ways you can do so
Text Link
photo Link
<span class="text-link">
<span>
<a target="_blank" href=https://pikwizard.com/photo/global-financial-data-with-graphs-and-world-map-visualization/92ffc45d5591cb5ac31bf974ce5f7b52/>PikWizard</a>
</span>
</span>
<span class="image-link">
<span
style="margin: 0 0 20px 0; display: inline-block; vertical-align: middle; width: 100%;"
>
<a
target="_blank"
href="https://pikwizard.com/photo/global-financial-data-with-graphs-and-world-map-visualization/92ffc45d5591cb5ac31bf974ce5f7b52/"
style="text-decoration: none; font-size: 10px; margin: 0;"
>
<img src="https://pikwizard.com/pw/medium/92ffc45d5591cb5ac31bf974ce5f7b52.jpg" style="margin: 0; width: 100%;" alt="" />
<p style="font-size: 12px; margin: 0;">PikWizard</p>
</a>
</span>
</span>
Free (free of charge)
Free for personal and commercial use.
Author: Creative Art
Similar Free Stock Images

Premium


Premium


Premium


Premium


Premium


Premium


Premium


Premium


Premium


Premium


Premium


Premium

Premium

Premium


Premium


Premium


Premium


Premium

Premium


Premium

Premium


Premium


Premium


Premium


Premium


Explore More Free Stock Images