- Home >
- Stock Photos >
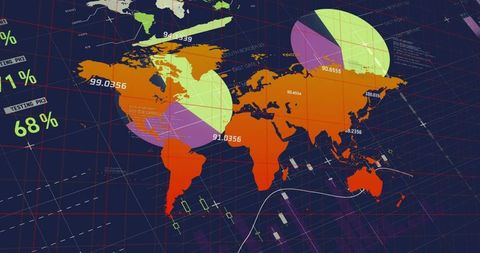
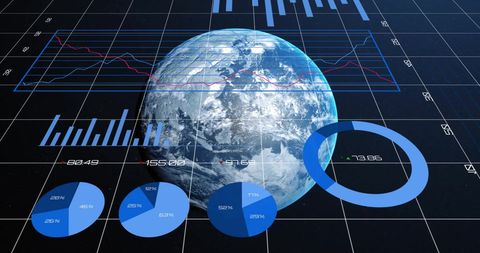
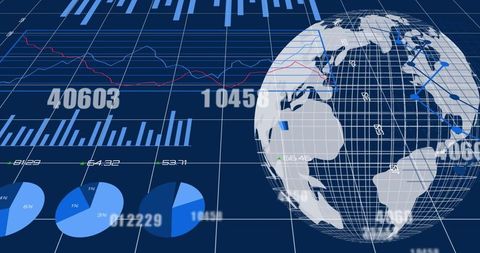
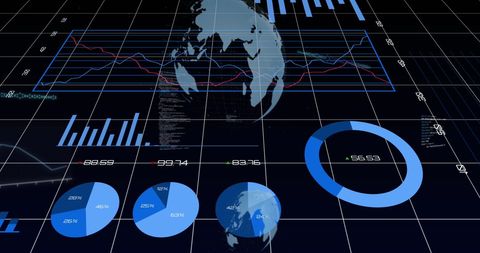
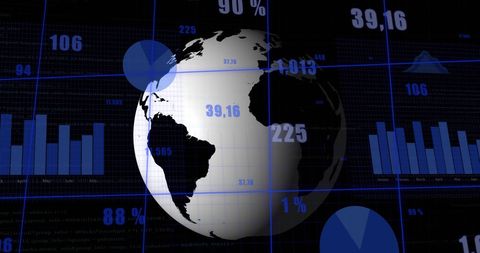
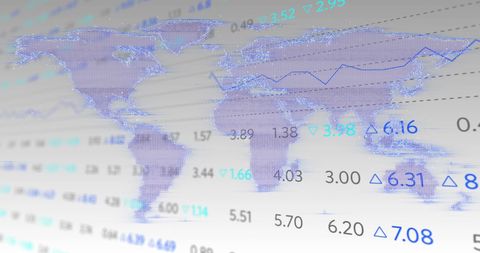
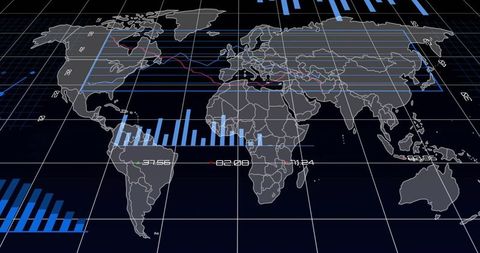
- Global Financial Data with Interactive Analytics and Charts
Global Financial Data with Interactive Analytics and Charts Image

Visual representation of global financial data overlaid on world map. Blue-themed background enhances modern and technological aspect. Ideal for illustrating economic growth, financial reports, and international business strategies. Suitable for use in finance-related presentations, digital data solutions adverts, and business analytics promotions.

downloads
Tags:
More
Credit Photo
If you would like to credit the Photo, here are some ways you can do so
Text Link
photo Link
<span class="text-link">
<span>
<a target="_blank" href=https://pikwizard.com/photo/global-financial-data-with-interactive-analytics-and-charts/a626db11c057e92b5fa6f56c6de41de5/>PikWizard</a>
</span>
</span>
<span class="image-link">
<span
style="margin: 0 0 20px 0; display: inline-block; vertical-align: middle; width: 100%;"
>
<a
target="_blank"
href="https://pikwizard.com/photo/global-financial-data-with-interactive-analytics-and-charts/a626db11c057e92b5fa6f56c6de41de5/"
style="text-decoration: none; font-size: 10px; margin: 0;"
>
<img src="https://pikwizard.com/pw/medium/a626db11c057e92b5fa6f56c6de41de5.jpg" style="margin: 0; width: 100%;" alt="" />
<p style="font-size: 12px; margin: 0;">PikWizard</p>
</a>
</span>
</span>
Free (free of charge)
Free for personal and commercial use.
Author: Creative Art