
- Home >
- Stock Photos >
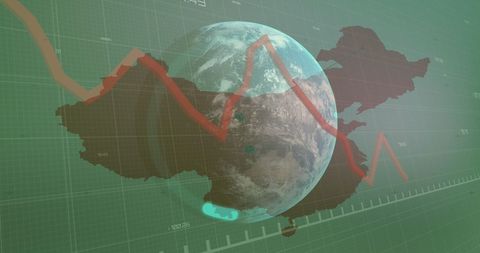
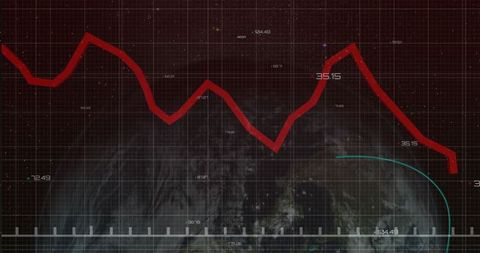
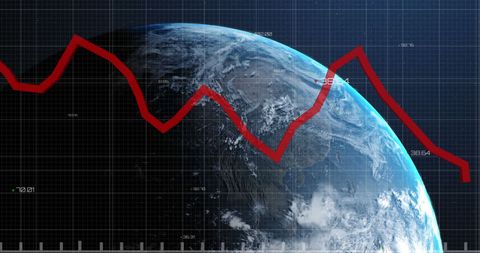
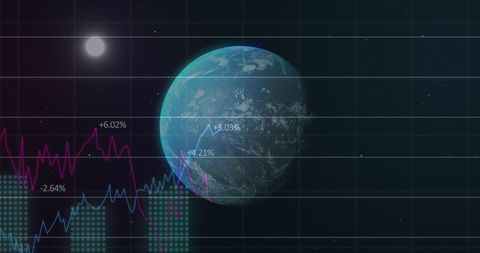
- Global Financial Decline and Data Visualization
Global Financial Decline and Data Visualization Image
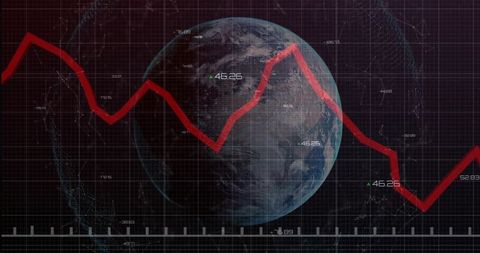
A futuristic depiction of a global financial decline using planet Earth with a red declining line graph over a dark grid. Ideal for illustrating concepts in global finance, economic forecasting, market analysis, and digital data visualization. Suitable for use in presentations on financial topics or articles about economic trends and digital analytics tools.
Powered by  - Get 15% off with code: PIKWIZARD15


downloads
Tags:
More
Credit Photo
If you would like to credit the Photo, here are some ways you can do so
Text Link
photo Link
<span class="text-link">
<span>
<a target="_blank" href=https://pikwizard.com/photo/global-financial-decline-and-data-visualization/12839f87703cd28297d2bbf42cc0e0ac/>PikWizard</a>
</span>
</span>
<span class="image-link">
<span
style="margin: 0 0 20px 0; display: inline-block; vertical-align: middle; width: 100%;"
>
<a
target="_blank"
href="https://pikwizard.com/photo/global-financial-decline-and-data-visualization/12839f87703cd28297d2bbf42cc0e0ac/"
style="text-decoration: none; font-size: 10px; margin: 0;"
>
<img src="https://pikwizard.com/pw/medium/12839f87703cd28297d2bbf42cc0e0ac.jpg" style="margin: 0; width: 100%;" alt="" />
<p style="font-size: 12px; margin: 0;">PikWizard</p>
</a>
</span>
</span>
Free (free of charge)
Free for personal and commercial use.
Author: Creative Art
Similar Free Stock Images

Premium


Premium


Premium


Premium


Premium

Premium


Premium


Premium


Premium

Premium


Premium


Premium


Premium


Premium

Premium


Premium


Premium


Premium


Premium

Premium


Premium


Premium


Premium


Premium

Premium


Explore More Free Stock Images