
- Home >
- Stock Photos >
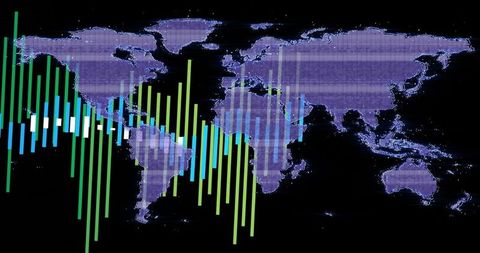
- Global Financial Decline Visualization on World Map
Global Financial Decline Visualization on World Map Image

Dynamic visualization showing global financial decline with a red descending line graph overlaid on a map of the world. This image highlights economic challenges and trends. Suitable for presentations, articles, and reports focused on global economies, financial crises, or investment cautions. Great for educational materials discussing market conditions and financial analysis strategies.
Powered by  - Get 15% off with code: PIKWIZARD15


downloads
Tags:
More
Credit Photo
If you would like to credit the Photo, here are some ways you can do so
Text Link
photo Link
<span class="text-link">
<span>
<a target="_blank" href=https://pikwizard.com/photo/global-financial-decline-visualization-on-world-map/e48ae29f1b0cc347c3daae2079eb0a66/>PikWizard</a>
</span>
</span>
<span class="image-link">
<span
style="margin: 0 0 20px 0; display: inline-block; vertical-align: middle; width: 100%;"
>
<a
target="_blank"
href="https://pikwizard.com/photo/global-financial-decline-visualization-on-world-map/e48ae29f1b0cc347c3daae2079eb0a66/"
style="text-decoration: none; font-size: 10px; margin: 0;"
>
<img src="https://pikwizard.com/pw/medium/e48ae29f1b0cc347c3daae2079eb0a66.jpg" style="margin: 0; width: 100%;" alt="" />
<p style="font-size: 12px; margin: 0;">PikWizard</p>
</a>
</span>
</span>
Free (free of charge)
Free for personal and commercial use.
Author: Authentic Images
Similar Free Stock Images

Premium


Premium


Premium

Premium

Premium


Premium


Premium


Premium

Premium

Premium


Premium

Premium


Premium


Premium

Premium


Premium


Premium


Premium

Premium


Premium


Premium

Premium

Premium


Premium


Premium


Explore More Free Stock Images