- Home >
- Stock Photos >
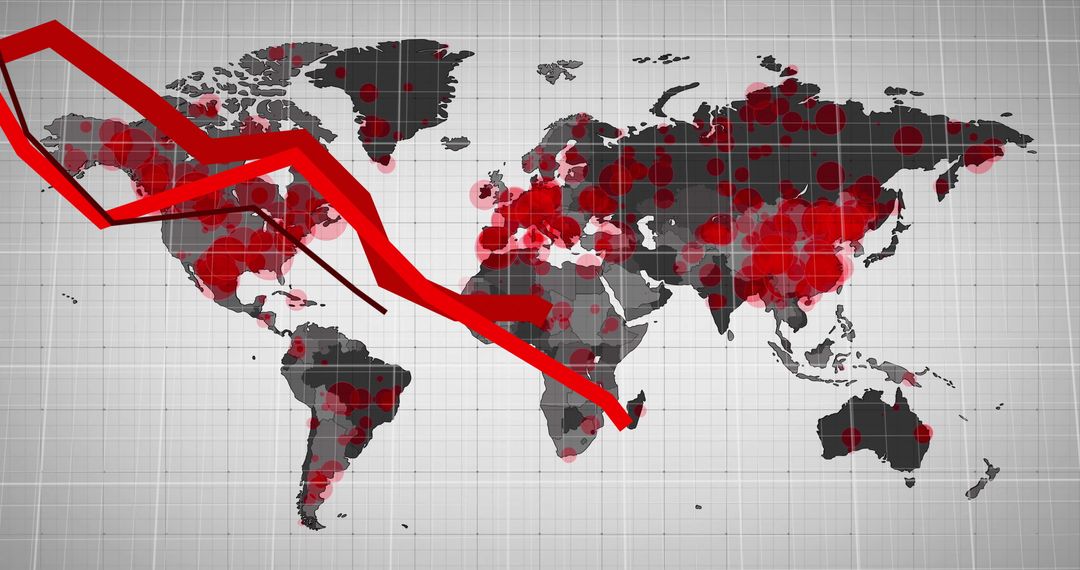
- Global Financial Downturn Over Map with Red Graph Line
Global Financial Downturn Over Map with Red Graph Line Image

Red graph line trending downwards over world map with digital grid background. Represents global financial downturn and market trends. Ideal for illustrating articles about economics, global market analysis, financial risks, data visualization.
Powered by  - Get 15% off with code: PIKWIZARD15


2
downloads
downloads
Tags:
Credit Photo
If you would like to credit the Photo, here are some ways you can do so
Text Link
photo Link
<span class="text-link">
<span>
<a target="_blank" href=https://pikwizard.com/photo/global-financial-downturn-over-map-with-red-graph-line/04c593f9397a232735643f314f3ff329/>PikWizard</a>
</span>
</span>
<span class="image-link">
<span
style="margin: 0 0 20px 0; display: inline-block; vertical-align: middle; width: 100%;"
>
<a
target="_blank"
href="https://pikwizard.com/photo/global-financial-downturn-over-map-with-red-graph-line/04c593f9397a232735643f314f3ff329/"
style="text-decoration: none; font-size: 10px; margin: 0;"
>
<img src="https://pikwizard.com/pw/medium/04c593f9397a232735643f314f3ff329.jpg" style="margin: 0; width: 100%;" alt="" />
<p style="font-size: 12px; margin: 0;">PikWizard</p>
</a>
</span>
</span>
Free (free of charge)
Free for personal and commercial use.
Author: People Creations
Similar Free Stock Images

Premium


Premium


Premium


Premium


Premium


Premium


Premium


Premium


Premium


Premium


Premium


Premium


Premium


Premium


Premium


Premium