- Home >
- Stock Photos >
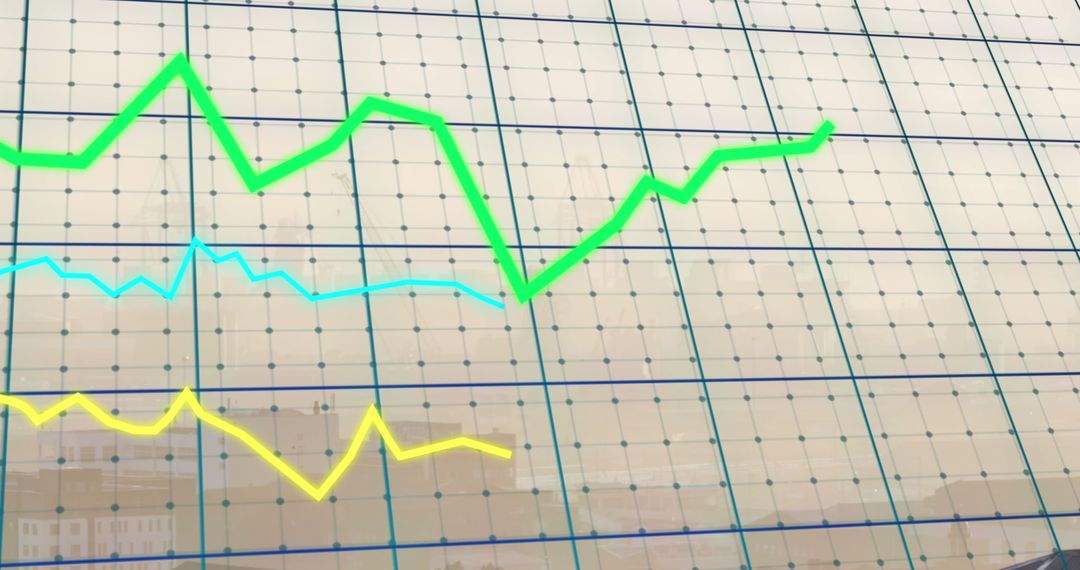
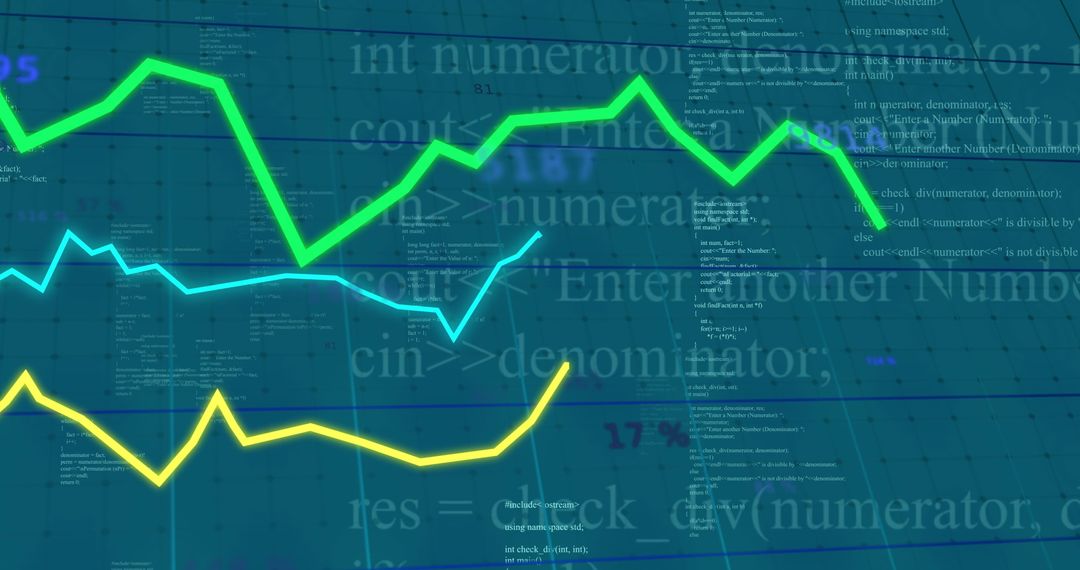
- Global Financial Graph Showing Decline Indicating Recession
Global Financial Graph Showing Decline Indicating Recession Image

Green line on graph showing downward trend against backdrop of financial data and world map represents economic downturn or recession. Useful for illustrating articles or reports on global financial challenges, economic strategies, or stock market analysis.
Powered by 


2
downloads
downloads
Tags:
More
Credit Photo
If you would like to credit the Photo, here are some ways you can do so
Text Link
photo Link
<span class="text-link">
<span>
<a target="_blank" href=https://pikwizard.com/photo/global-financial-graph-showing-decline-indicating-recession/8d64fce3196e1bae63017de140b87ede/>PikWizard</a>
</span>
</span>
<span class="image-link">
<span
style="margin: 0 0 20px 0; display: inline-block; vertical-align: middle; width: 100%;"
>
<a
target="_blank"
href="https://pikwizard.com/photo/global-financial-graph-showing-decline-indicating-recession/8d64fce3196e1bae63017de140b87ede/"
style="text-decoration: none; font-size: 10px; margin: 0;"
>
<img src="https://pikwizard.com/pw/medium/8d64fce3196e1bae63017de140b87ede.jpg" style="margin: 0; width: 100%;" alt="" />
<p style="font-size: 12px; margin: 0;">PikWizard</p>
</a>
</span>
</span>
Free (free of charge)
Free for personal and commercial use.
Author: Awesome Content
Similar Free Stock Images

Premium


Premium


Premium


Premium


Premium


Premium


Premium


Premium


Premium


Premium


Premium


Premium


Premium


Premium


Premium


Premium


Premium


Premium


Premium


Premium


Premium


Premium


Premium


Premium