- Home >
- Stock Photos >
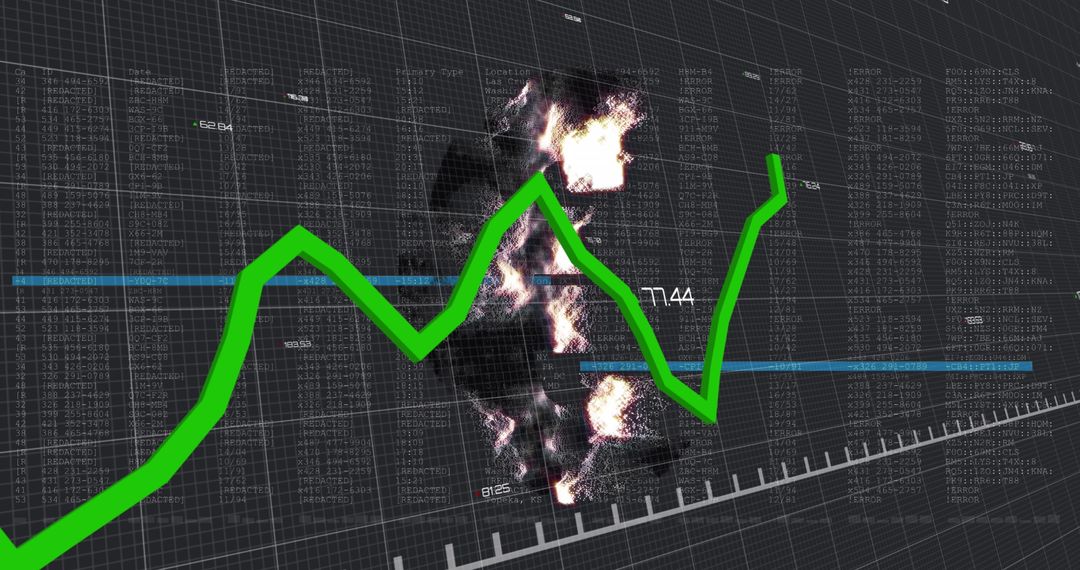
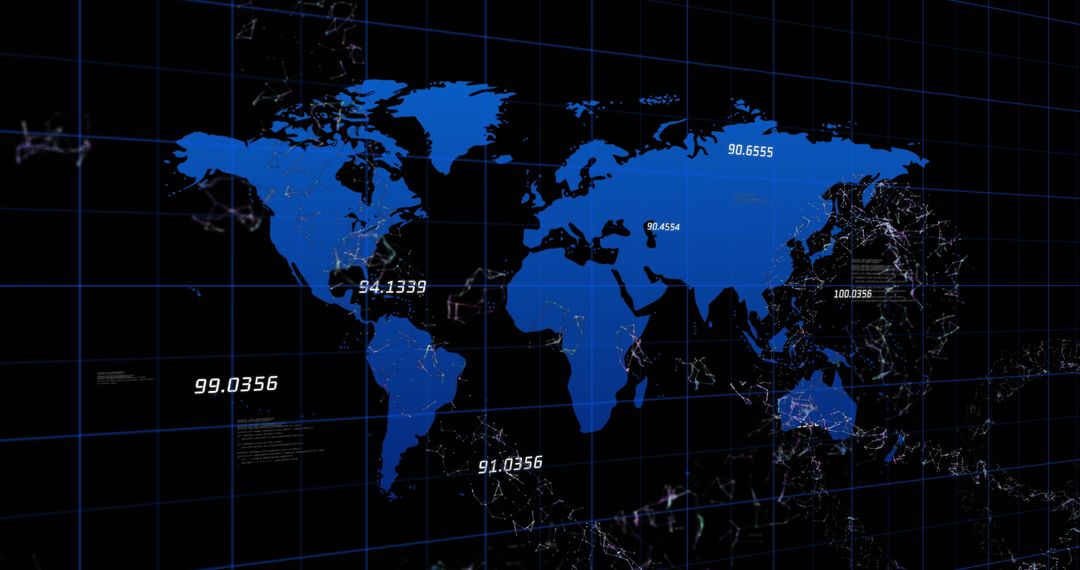
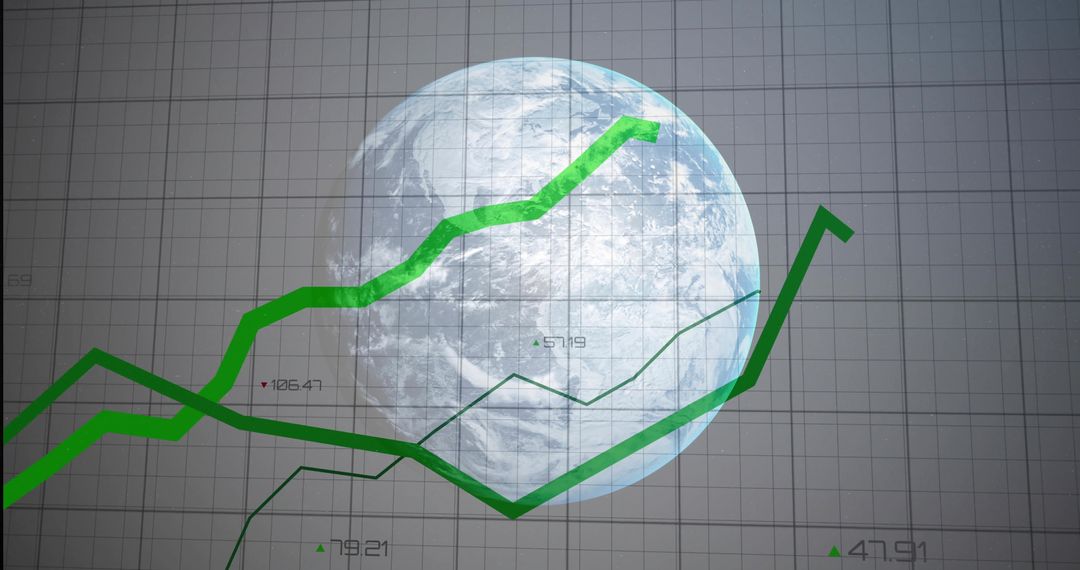
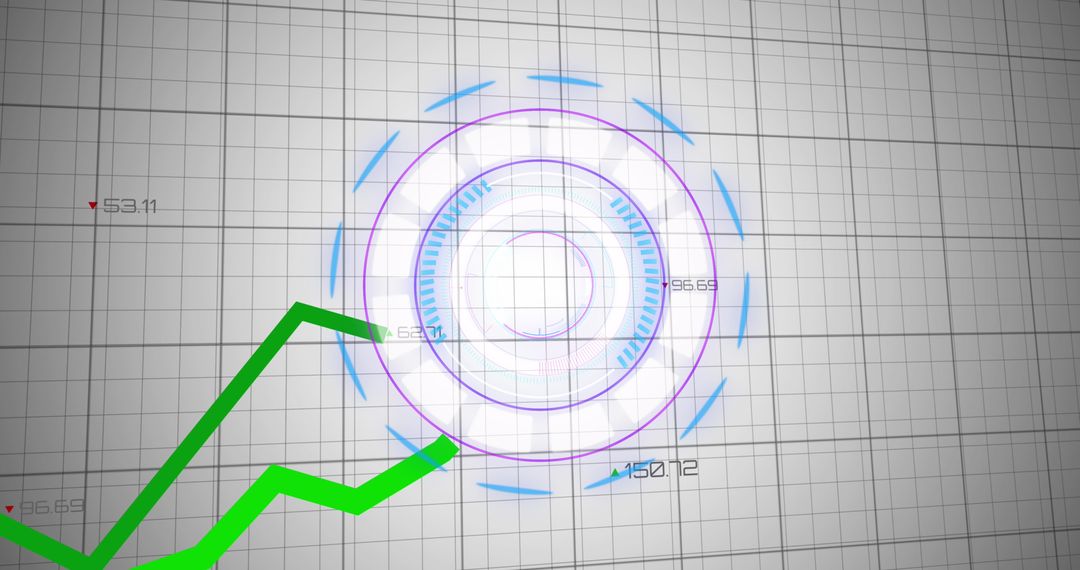
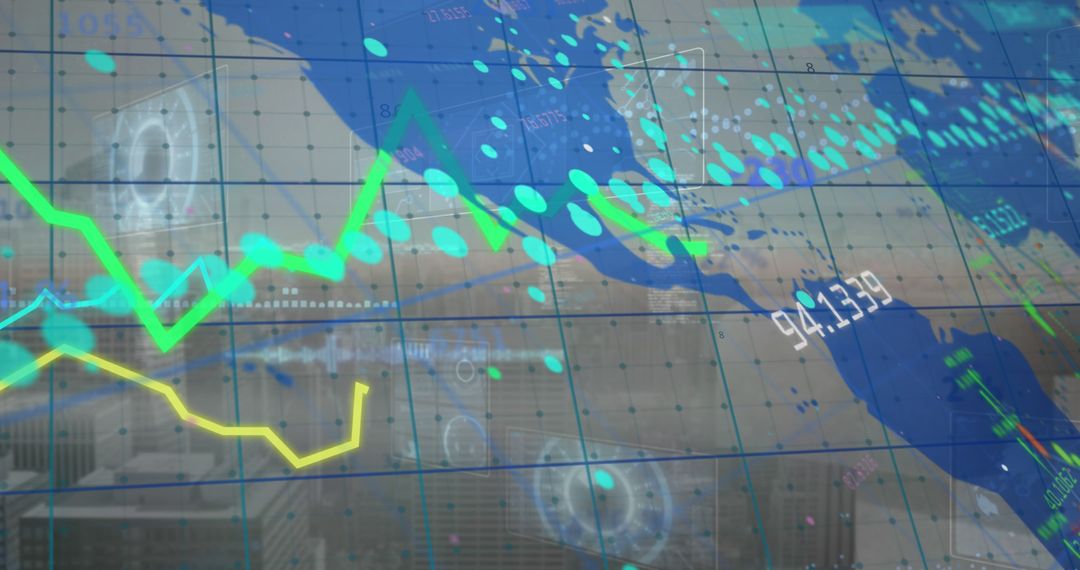
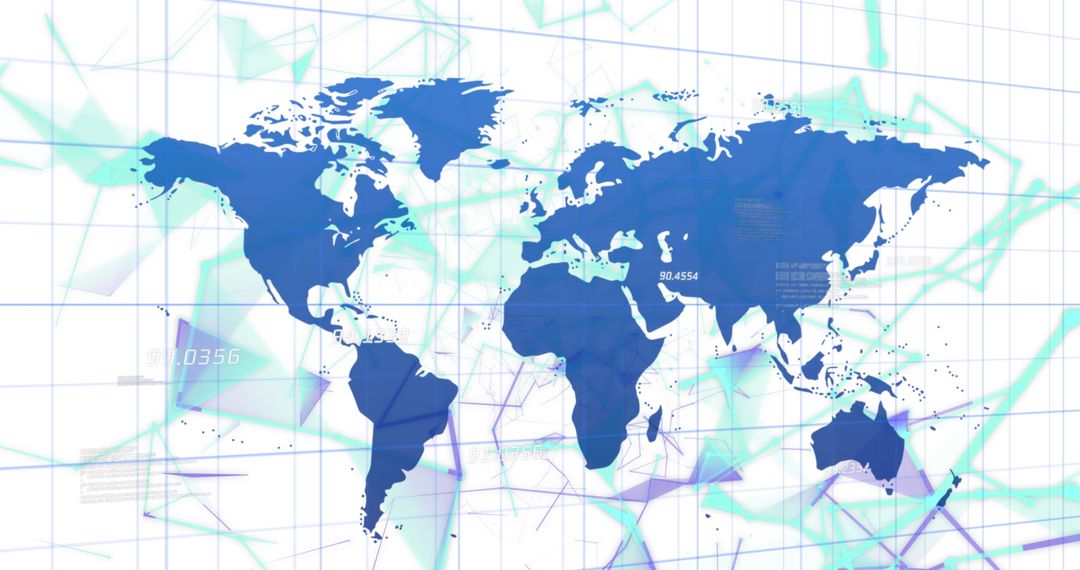
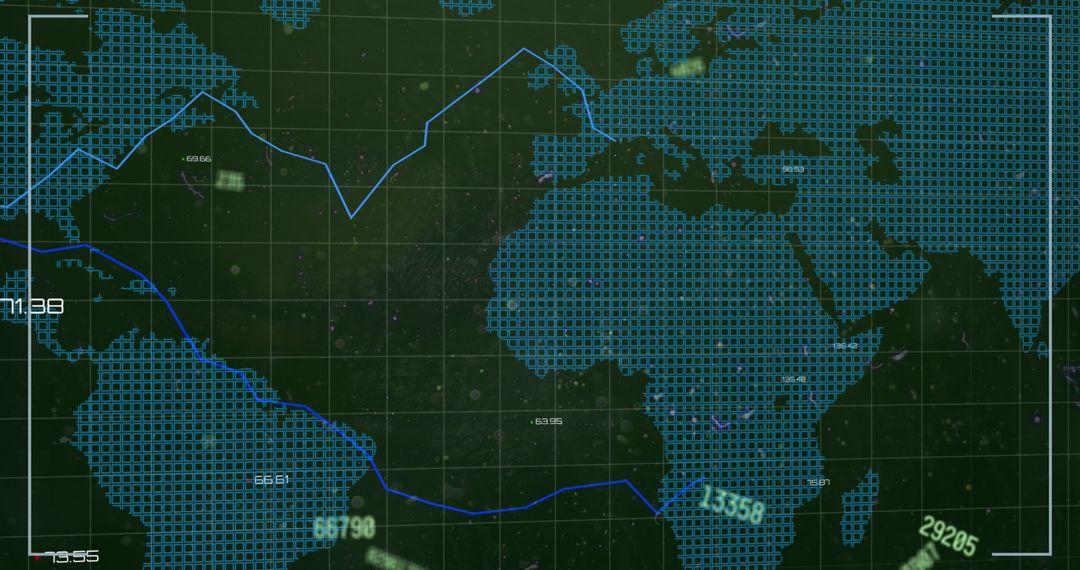
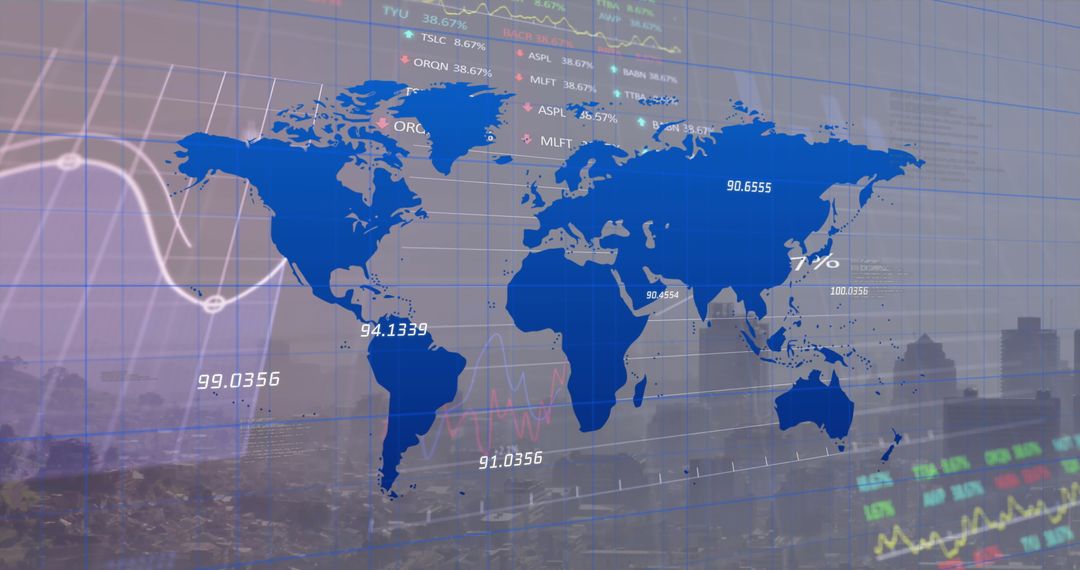
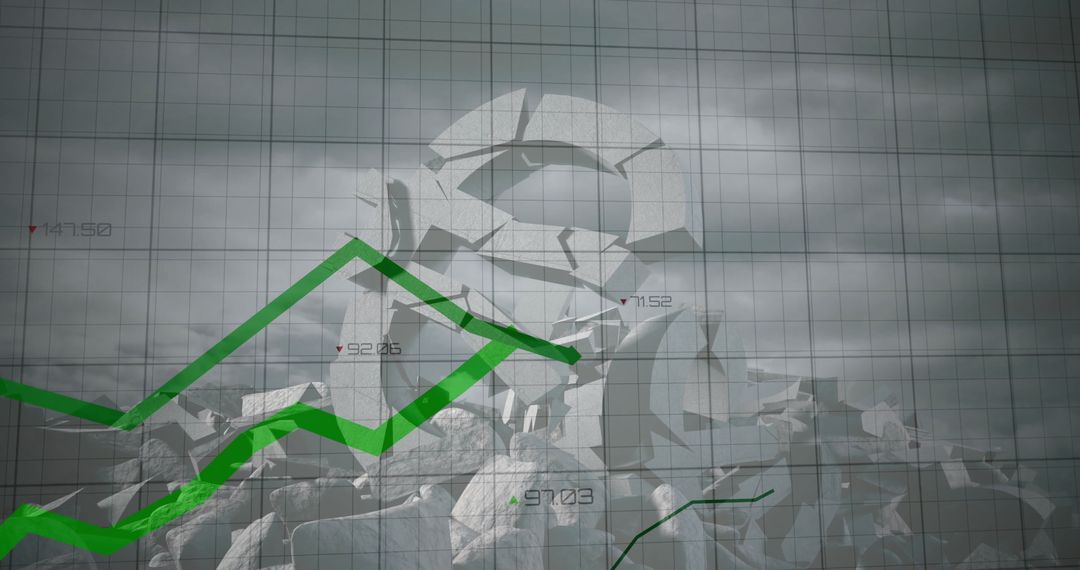
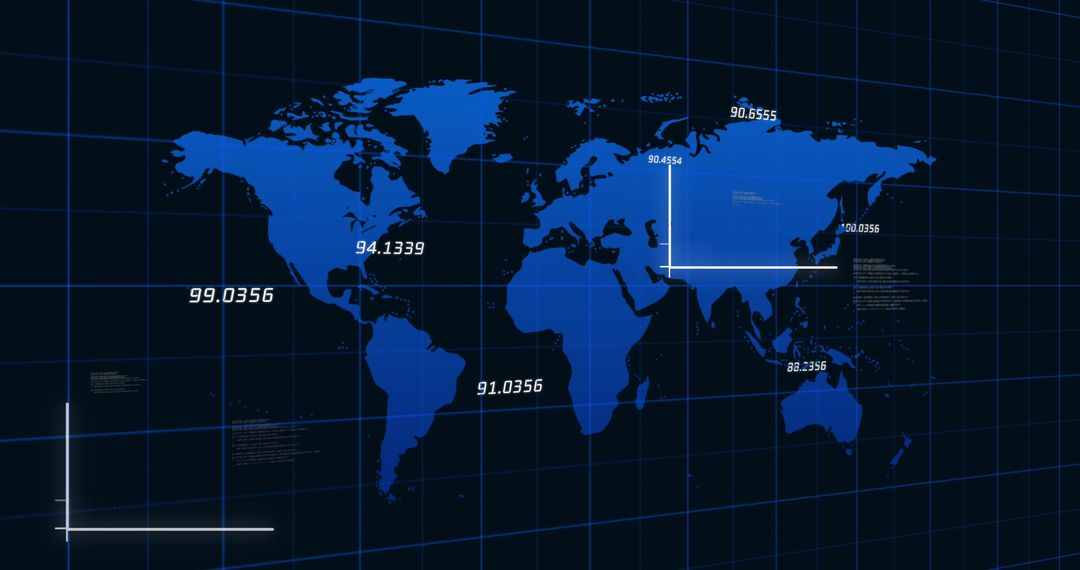
- Global Financial Growth Analysis with Digital Graphs and Map
Global Financial Growth Analysis with Digital Graphs and Map Image

Illustration features digital graphs and numbers overlay on a world map, representing financial growth and analysis. Useful for presentations on global economy trends, business reports, or data visualization concepts. Represents abstract ways the digital world connects to economic metrics globally.
Powered by 


2
downloads
downloads
Tags:
More
Credit Photo
If you would like to credit the Photo, here are some ways you can do so
Text Link
photo Link
<span class="text-link">
<span>
<a target="_blank" href=https://pikwizard.com/photo/global-financial-growth-analysis-with-digital-graphs-and-map/3cce8d3b9f9980348f793e2c22cb5c2b/>PikWizard</a>
</span>
</span>
<span class="image-link">
<span
style="margin: 0 0 20px 0; display: inline-block; vertical-align: middle; width: 100%;"
>
<a
target="_blank"
href="https://pikwizard.com/photo/global-financial-growth-analysis-with-digital-graphs-and-map/3cce8d3b9f9980348f793e2c22cb5c2b/"
style="text-decoration: none; font-size: 10px; margin: 0;"
>
<img src="https://pikwizard.com/pw/medium/3cce8d3b9f9980348f793e2c22cb5c2b.jpg" style="margin: 0; width: 100%;" alt="" />
<p style="font-size: 12px; margin: 0;">PikWizard</p>
</a>
</span>
</span>
Free (free of charge)
Free for personal and commercial use.
Author: People Creations
Similar Free Stock Images

Premium


Premium


Premium


Premium


Premium


Premium


Premium


Premium


Premium


Premium


Premium


Premium


Premium


Premium


Premium


Premium


Premium


Premium


Premium


Premium


Premium


Premium


Premium


Premium