- Home >
- Stock Photos >
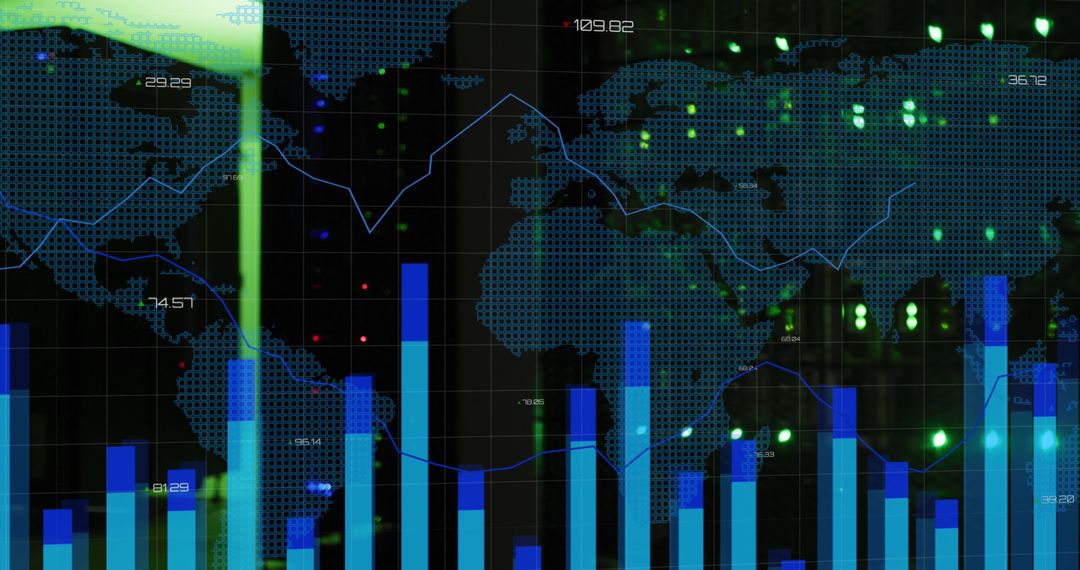
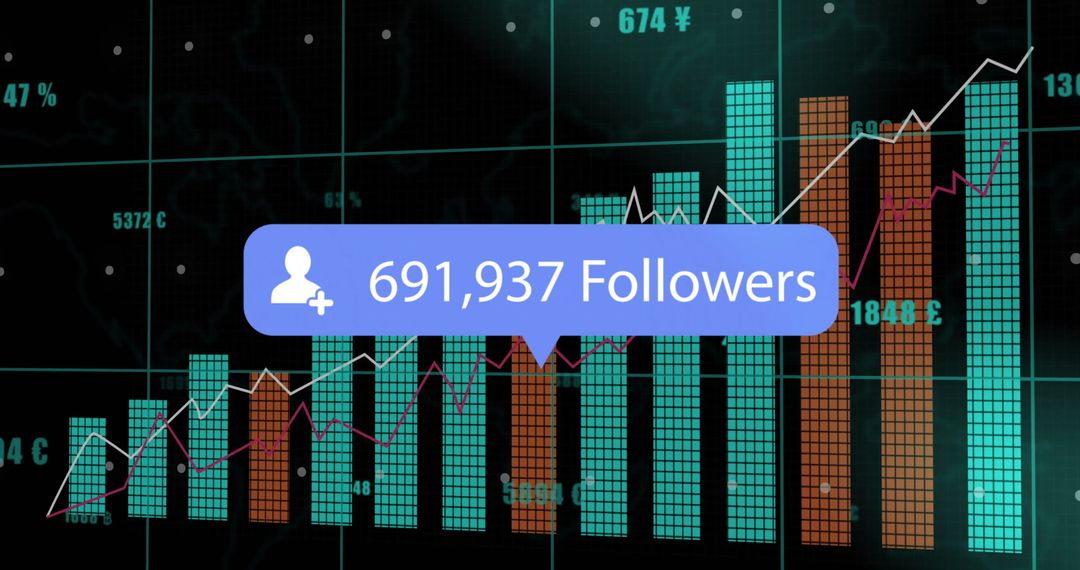
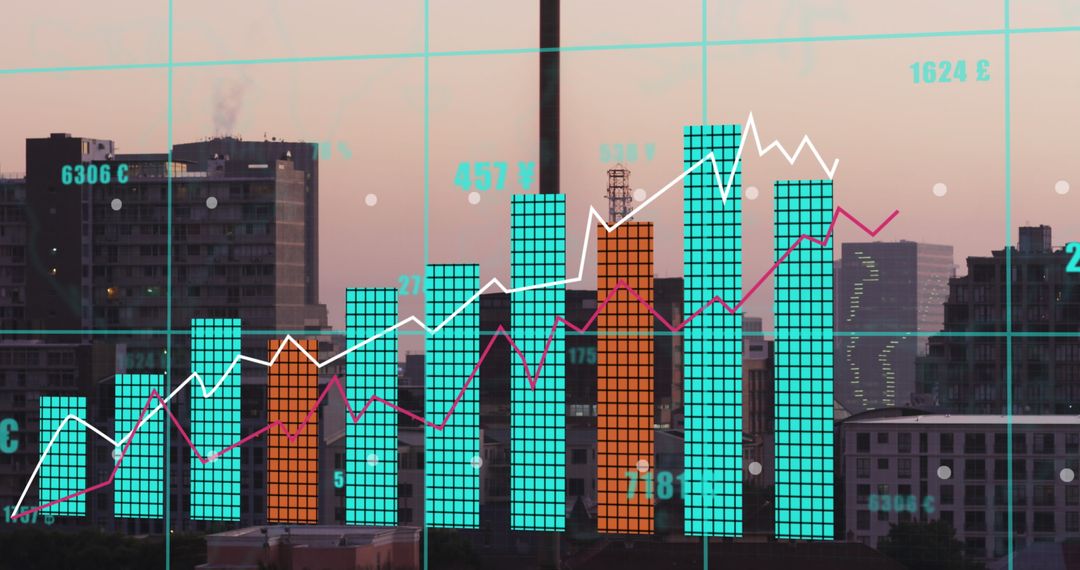
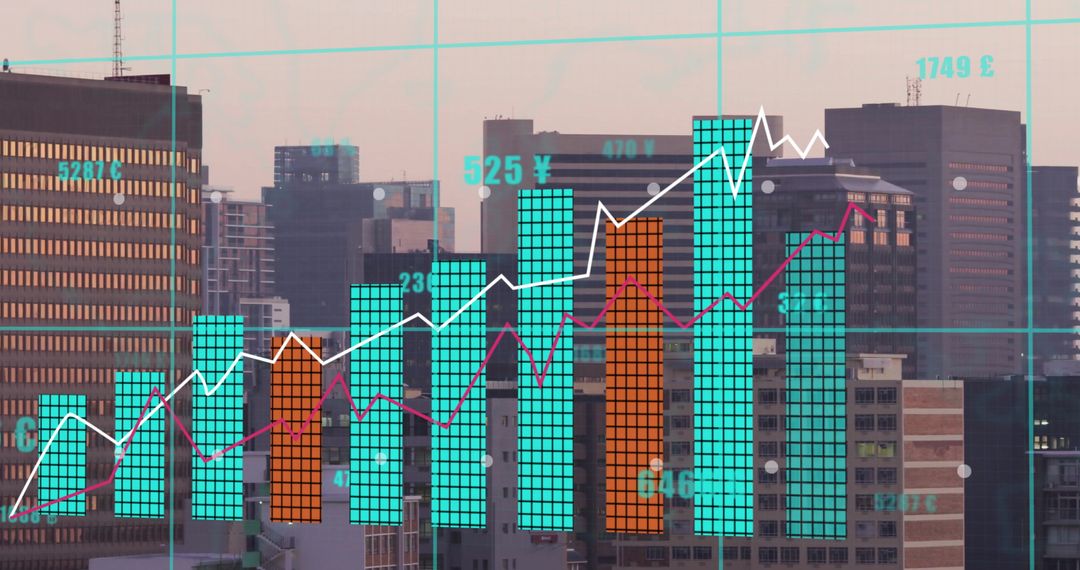
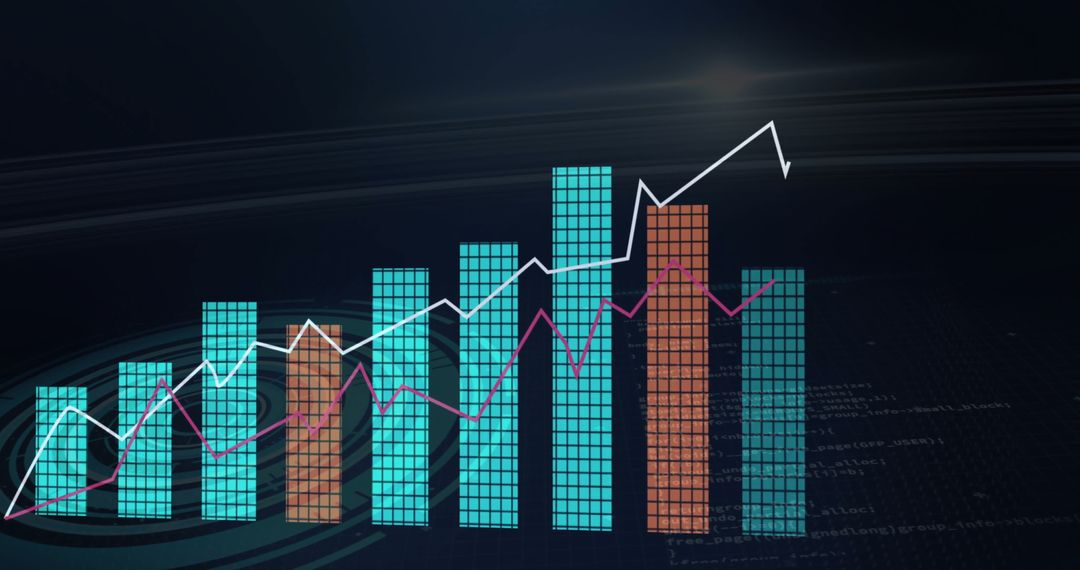
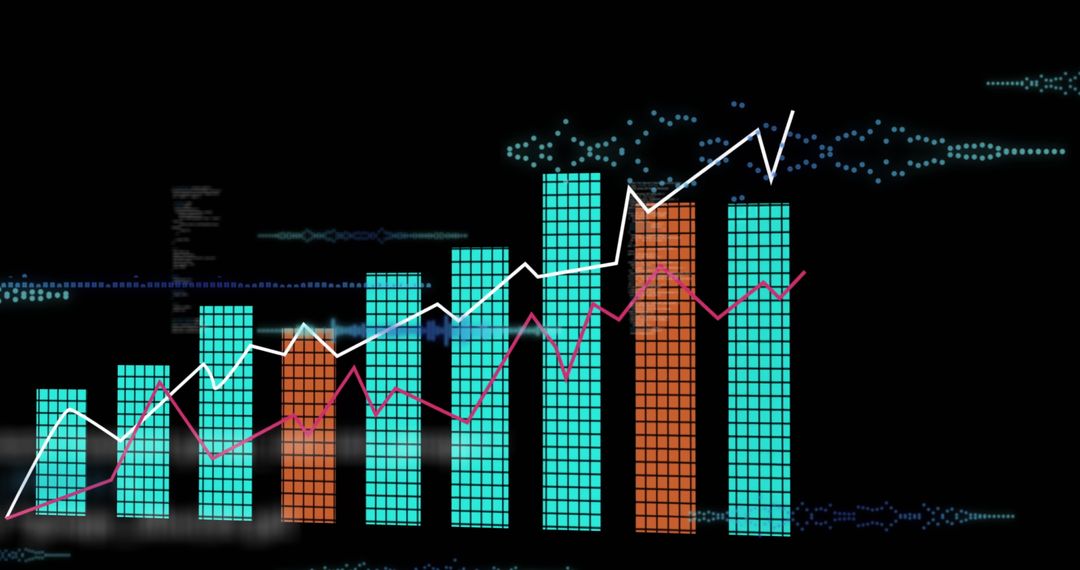
- Global Financial Growth Trends Visualization with Data Graphs
Global Financial Growth Trends Visualization with Data Graphs Image

Vibrant graphical representation of financial data signifies global growth and market trends, showcasing fluctuations in currency values and investment strategies. Useful for illustrating economic analysis, business development insights, and trend prediction in finance articles or presentations.
Powered by 


2
downloads
downloads
Tags:
More
Credit Photo
If you would like to credit the Photo, here are some ways you can do so
Text Link
photo Link
<span class="text-link">
<span>
<a target="_blank" href=https://pikwizard.com/photo/global-financial-growth-trends-visualization-with-data-graphs/cb68529311d513c12fc317154d8c286e/>PikWizard</a>
</span>
</span>
<span class="image-link">
<span
style="margin: 0 0 20px 0; display: inline-block; vertical-align: middle; width: 100%;"
>
<a
target="_blank"
href="https://pikwizard.com/photo/global-financial-growth-trends-visualization-with-data-graphs/cb68529311d513c12fc317154d8c286e/"
style="text-decoration: none; font-size: 10px; margin: 0;"
>
<img src="https://pikwizard.com/pw/medium/cb68529311d513c12fc317154d8c286e.jpg" style="margin: 0; width: 100%;" alt="" />
<p style="font-size: 12px; margin: 0;">PikWizard</p>
</a>
</span>
</span>
Free (free of charge)
Free for personal and commercial use.
Author: People Creations
Similar Free Stock Images
Premium


Premium


Premium


Premium


Premium


Premium


Premium


Premium


Premium


Premium


Premium


Premium


Premium


Premium


Premium


Premium


Premium


Premium


Premium


Premium


Premium


Premium


Premium


Premium