- Home >
- Stock Photos >
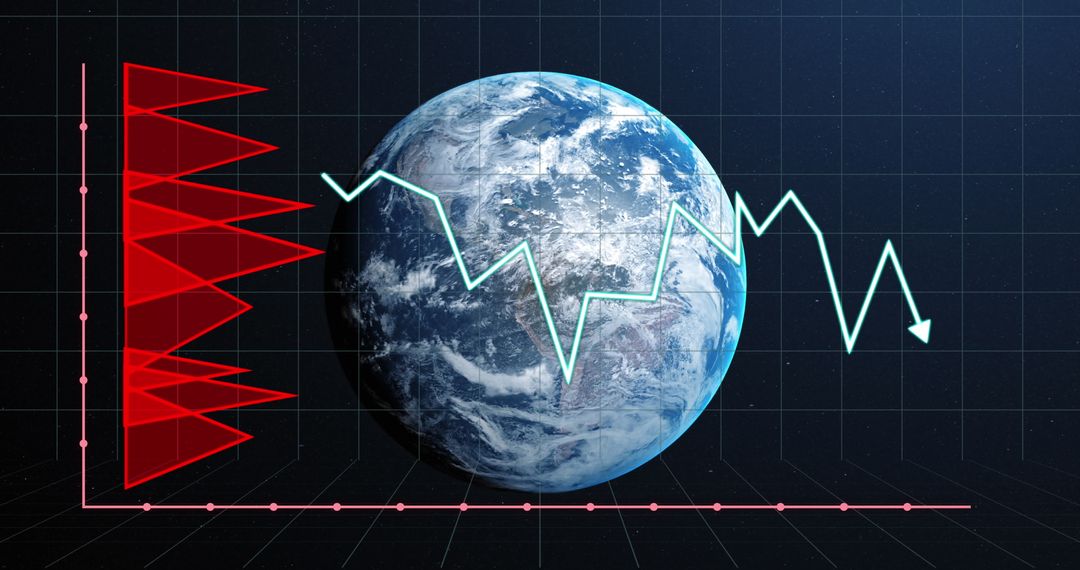
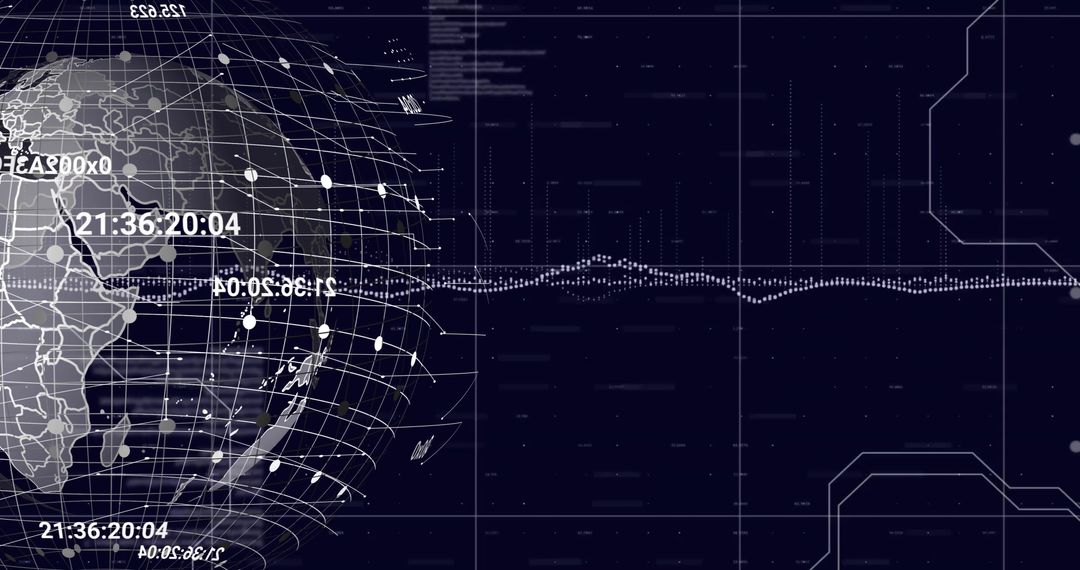
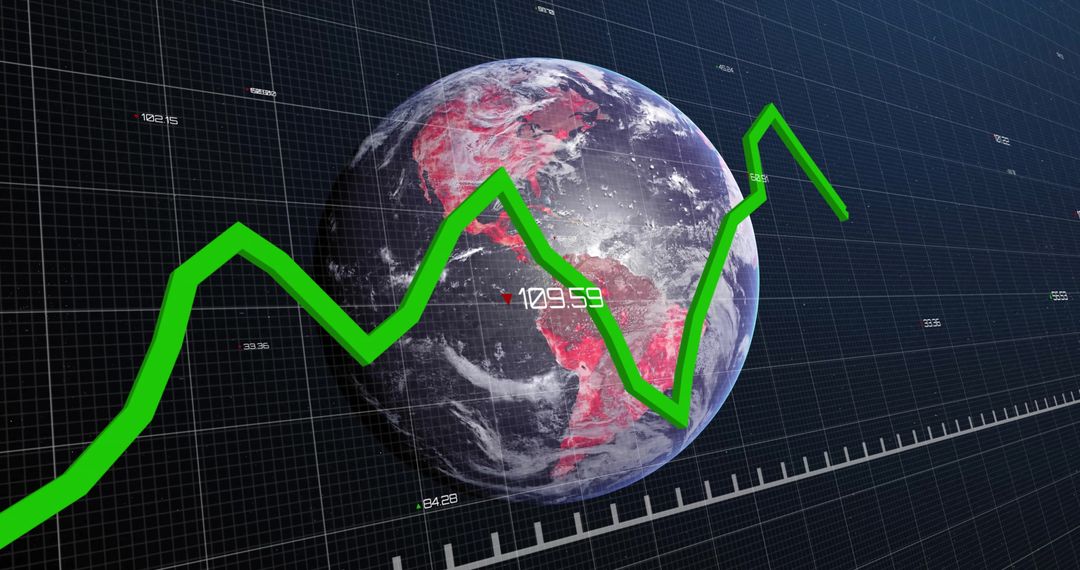
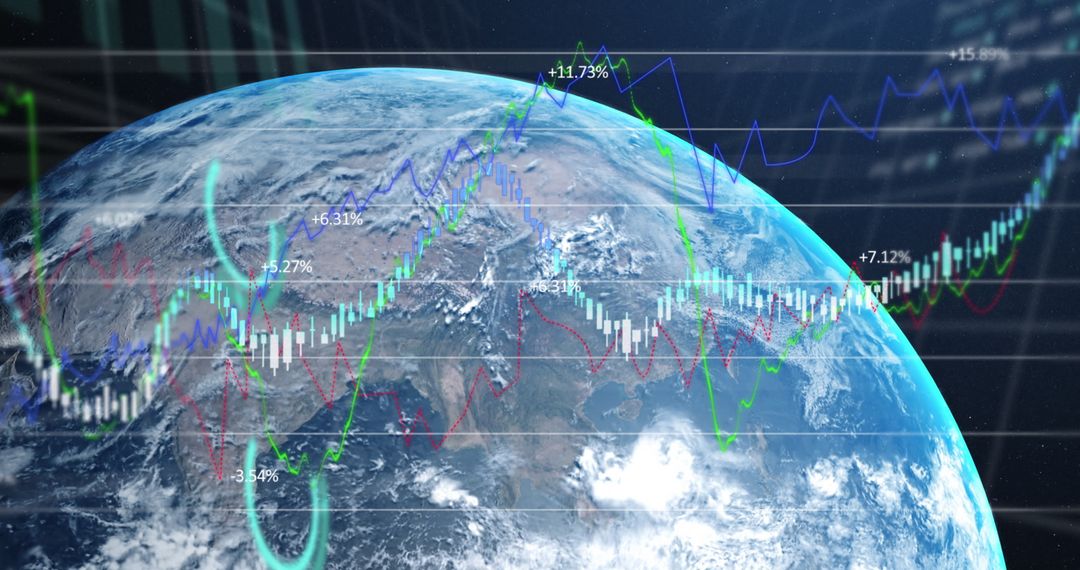
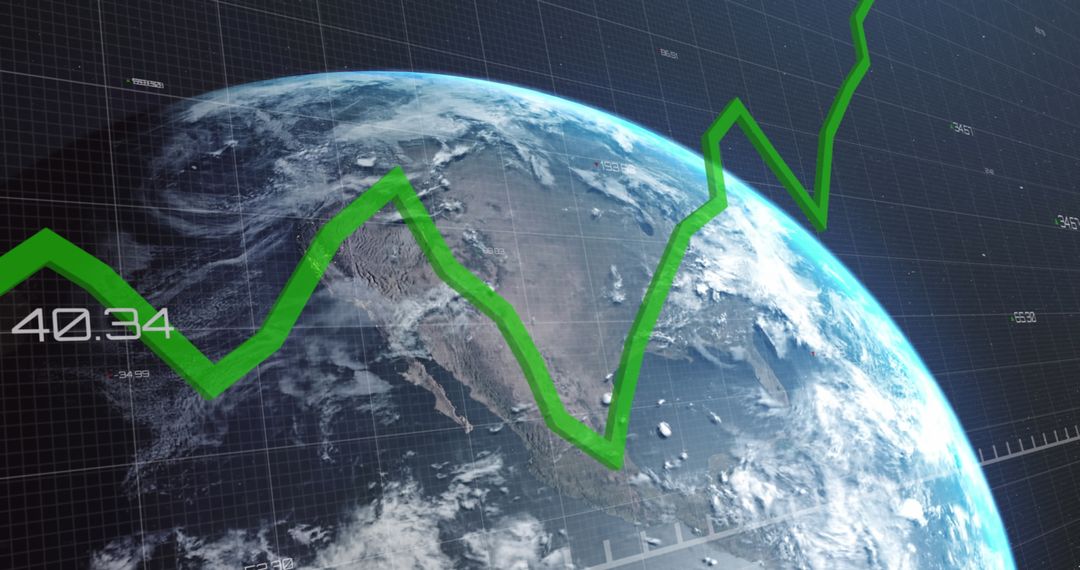
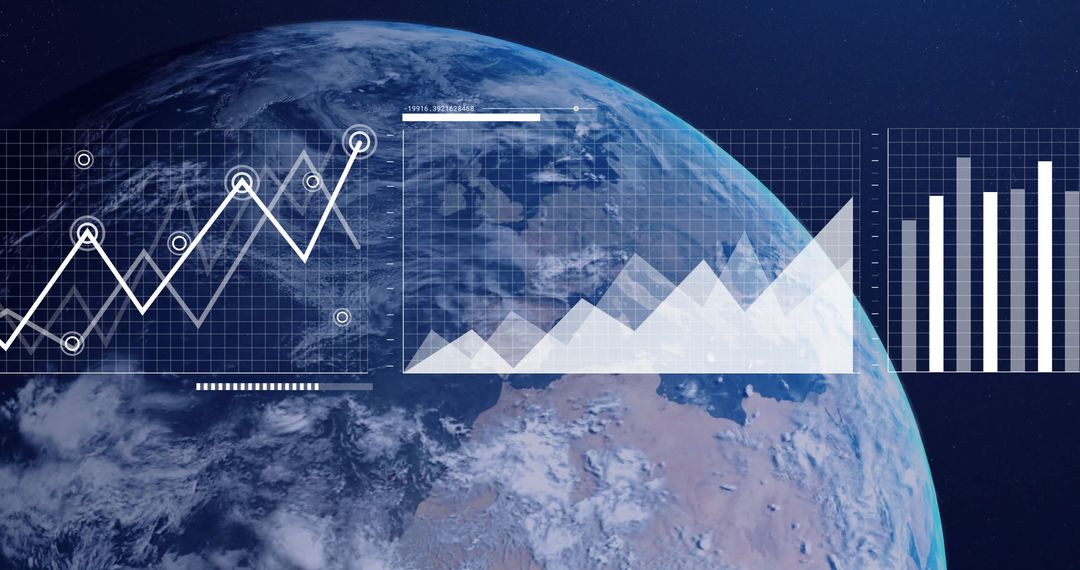
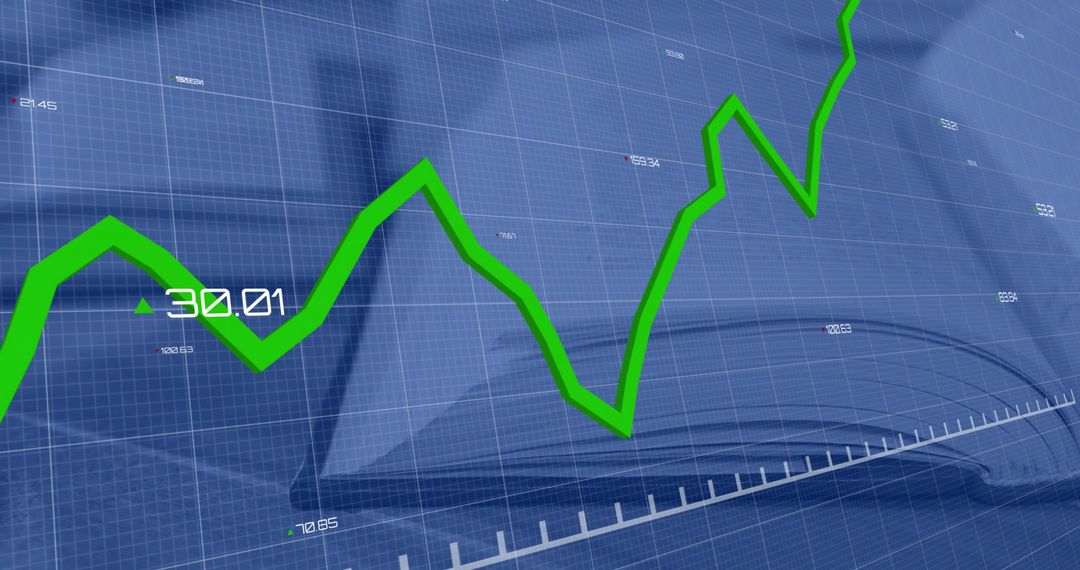
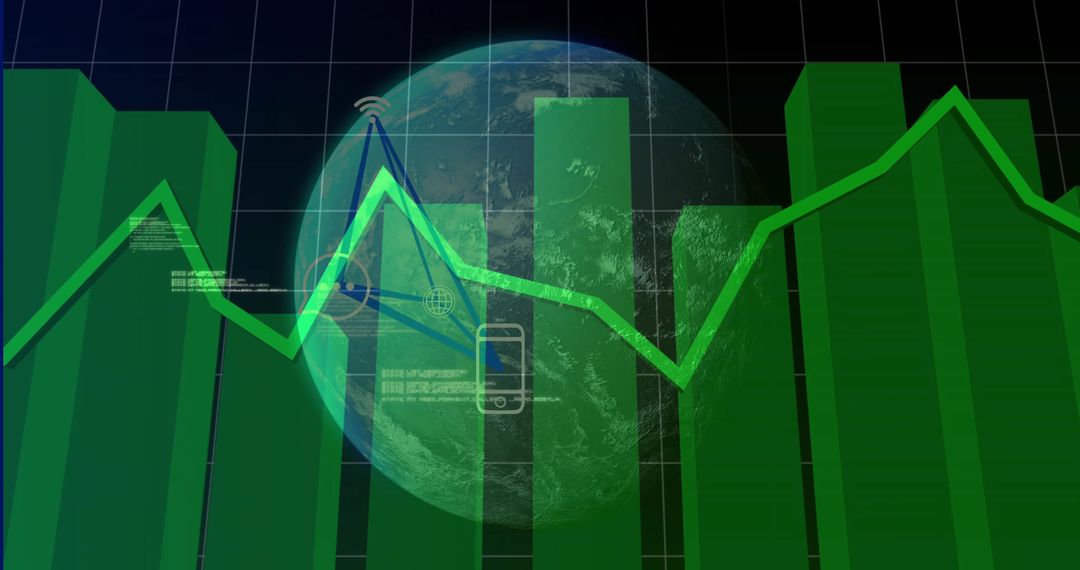
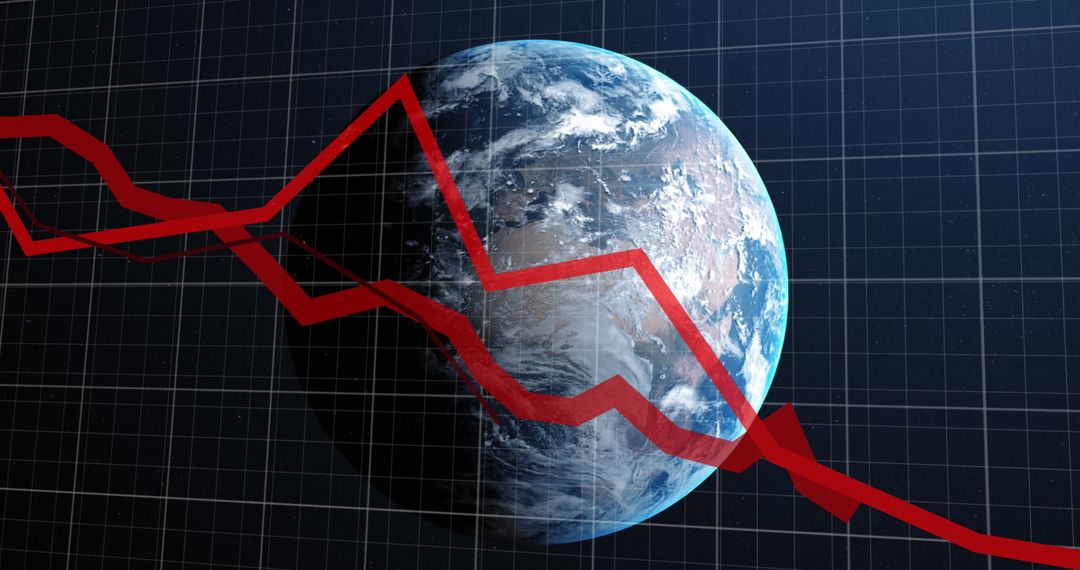
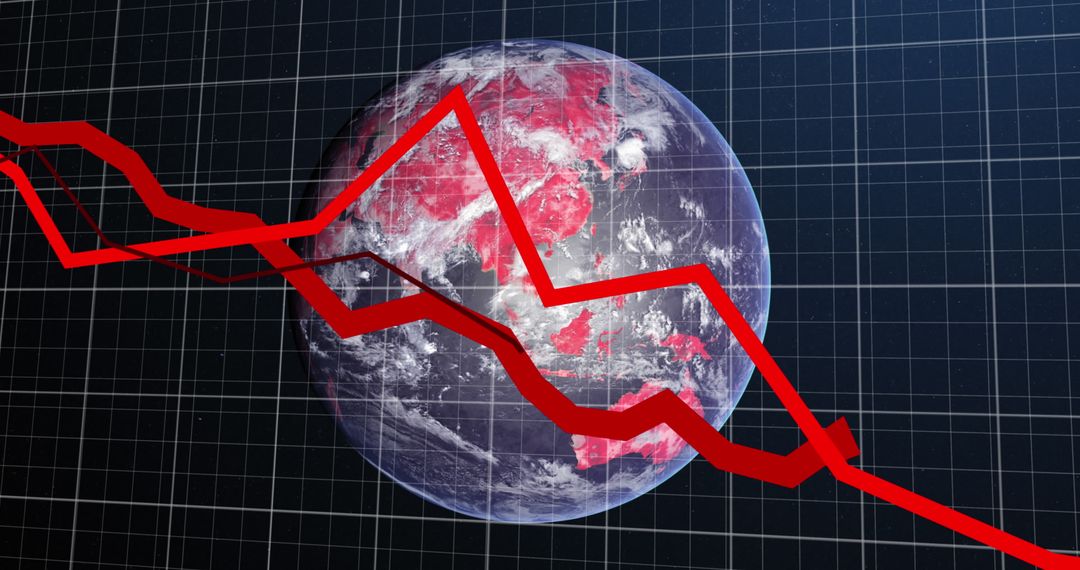
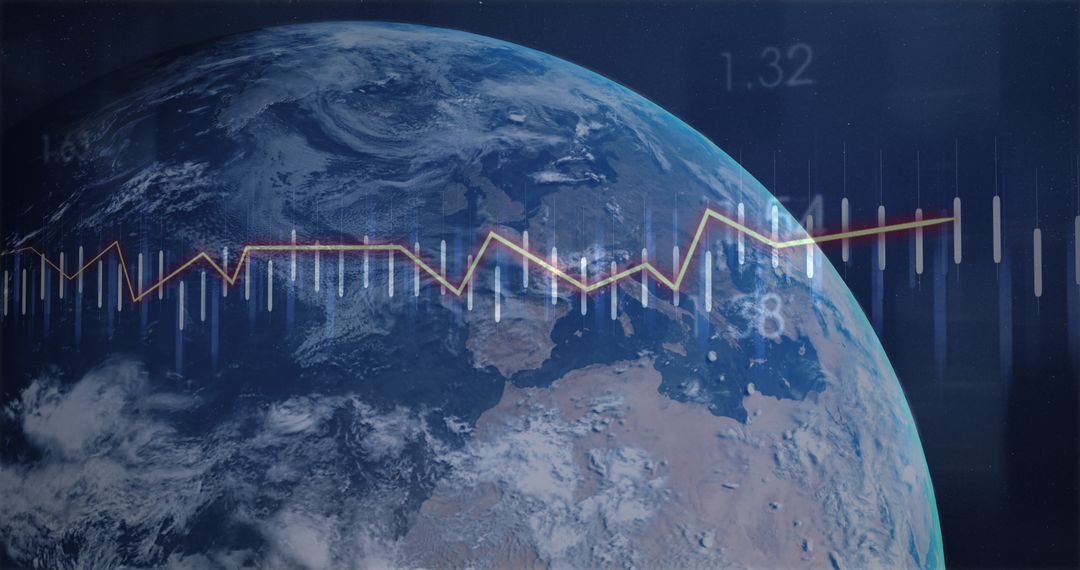
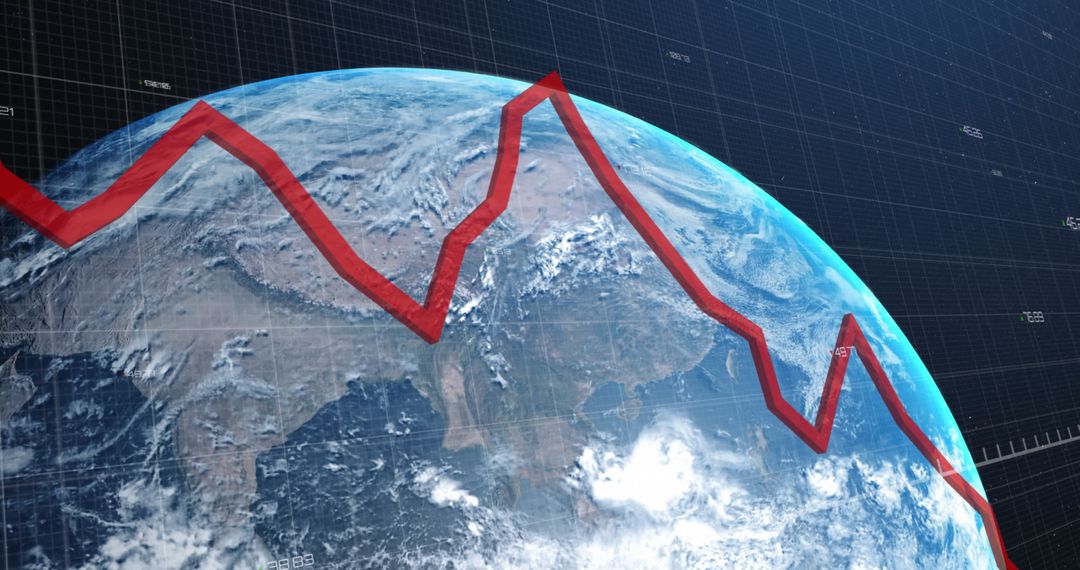
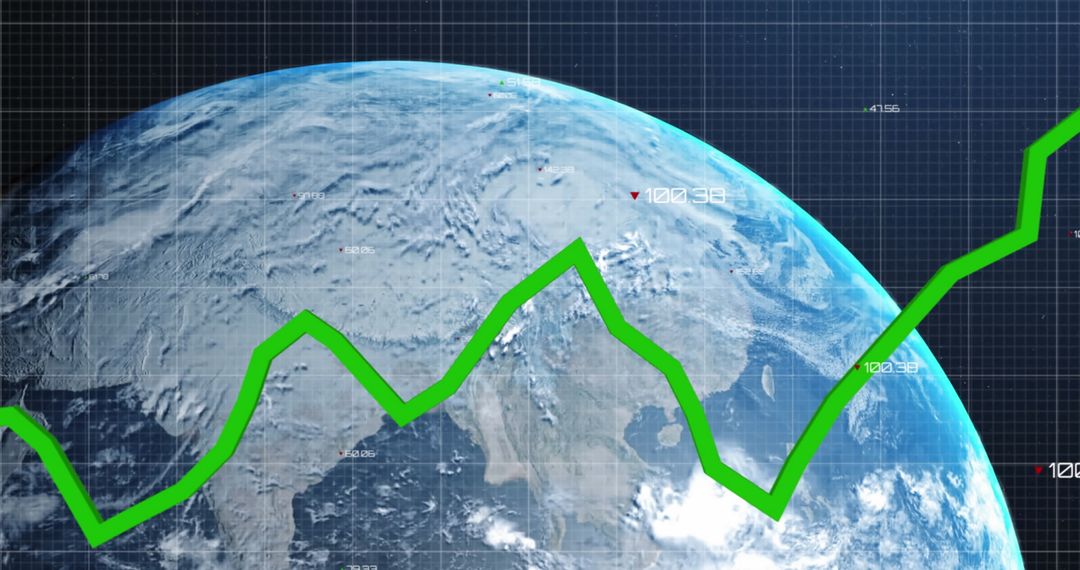
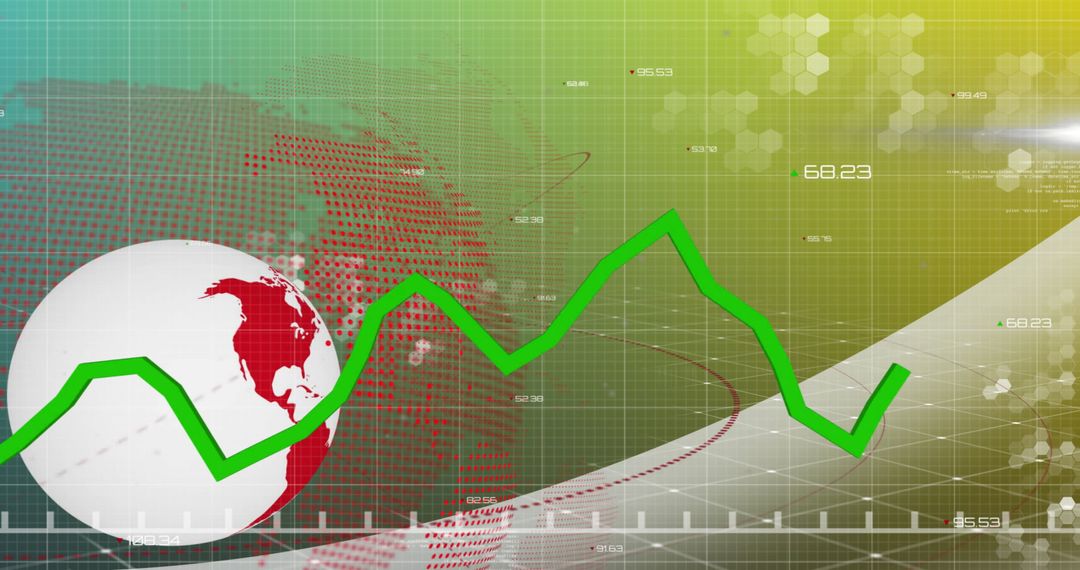
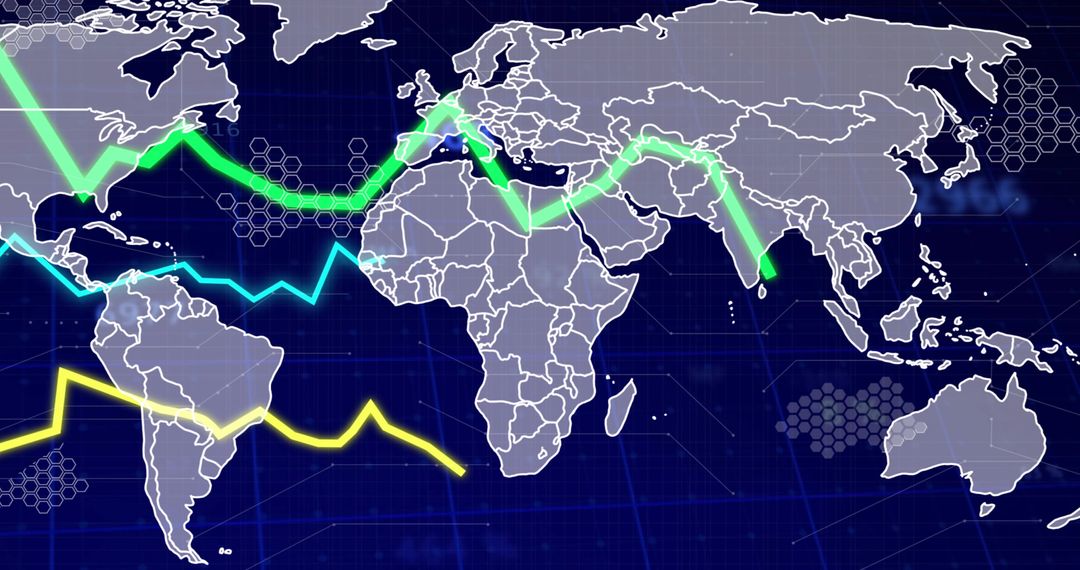
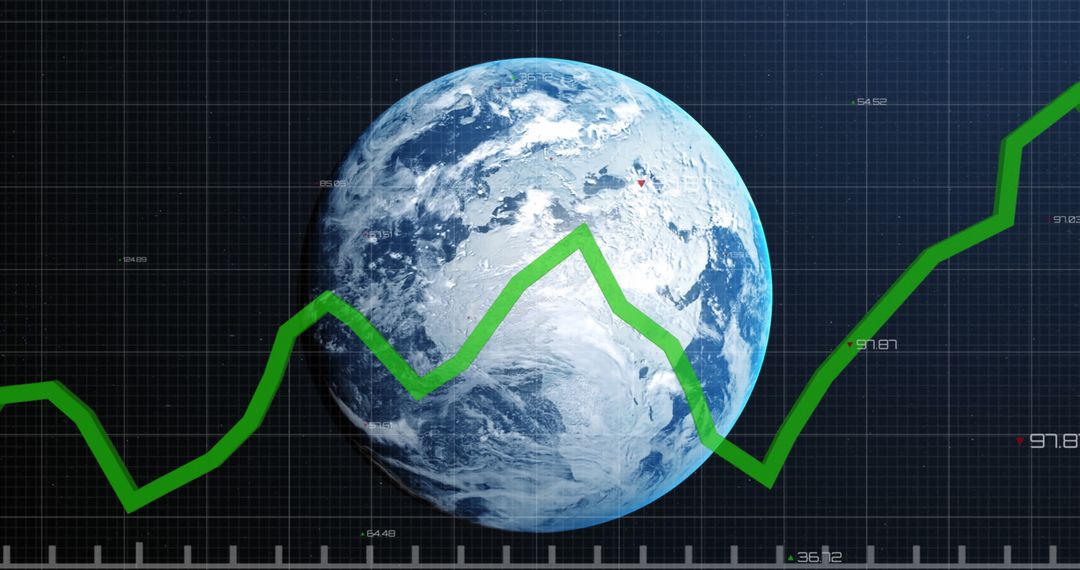
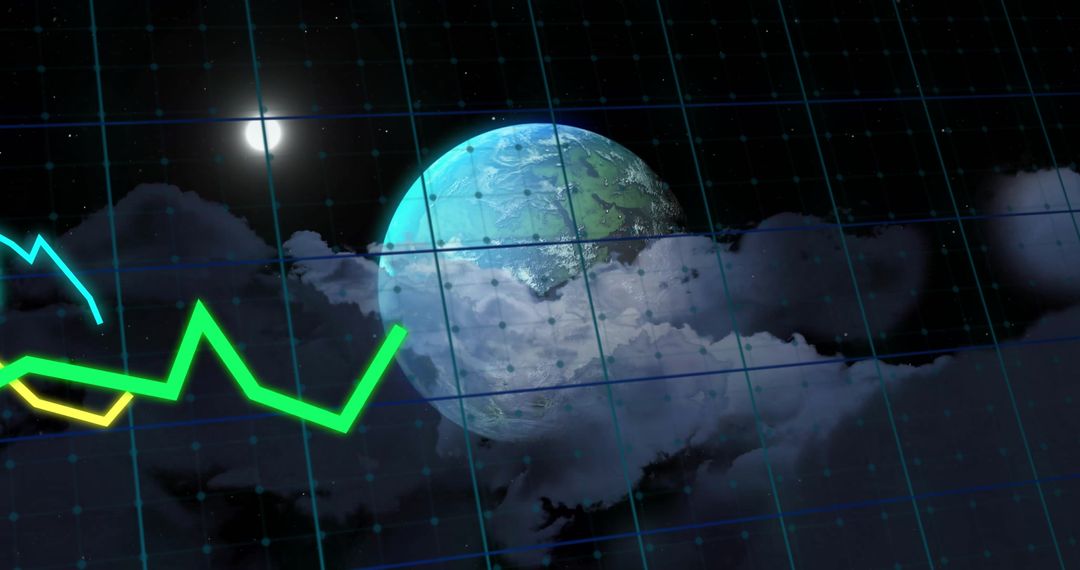
- Global Financial Growth Trends with Data Graph Over Earth
Global Financial Growth Trends with Data Graph Over Earth Image
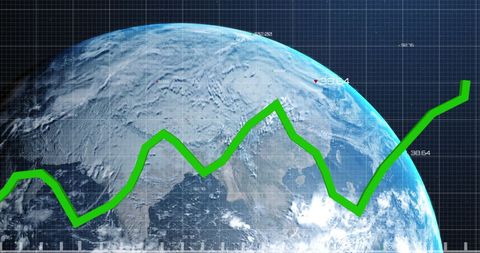
Graph depicting growing financial data over planet Earth underscores global business expansion and economic trends. Suitable for economic analysis reports, business strategy presentations, and educational materials in finance and economics.
Powered by  - Get 15% off with code: PIKWIZARD15


2
downloads
downloads
Tags:
More
Credit Photo
If you would like to credit the Photo, here are some ways you can do so
Text Link
photo Link
<span class="text-link">
<span>
<a target="_blank" href=https://pikwizard.com/photo/global-financial-growth-trends-with-data-graph-over-earth/33985cf6661f2eaa27c9a06f2eba0708/>PikWizard</a>
</span>
</span>
<span class="image-link">
<span
style="margin: 0 0 20px 0; display: inline-block; vertical-align: middle; width: 100%;"
>
<a
target="_blank"
href="https://pikwizard.com/photo/global-financial-growth-trends-with-data-graph-over-earth/33985cf6661f2eaa27c9a06f2eba0708/"
style="text-decoration: none; font-size: 10px; margin: 0;"
>
<img src="https://pikwizard.com/pw/medium/33985cf6661f2eaa27c9a06f2eba0708.jpg" style="margin: 0; width: 100%;" alt="" />
<p style="font-size: 12px; margin: 0;">PikWizard</p>
</a>
</span>
</span>
Free (free of charge)
Free for personal and commercial use.
Author: Awesome Content
Similar Free Stock Images

Premium


Premium


Premium


Premium


Premium


Premium


Premium


Premium


Premium


Premium


Premium


Premium


Premium

Premium


Premium


Premium

Premium


Premium


Premium


Premium


Premium


Premium


Premium


Premium


Premium