- Home >
- Stock Photos >
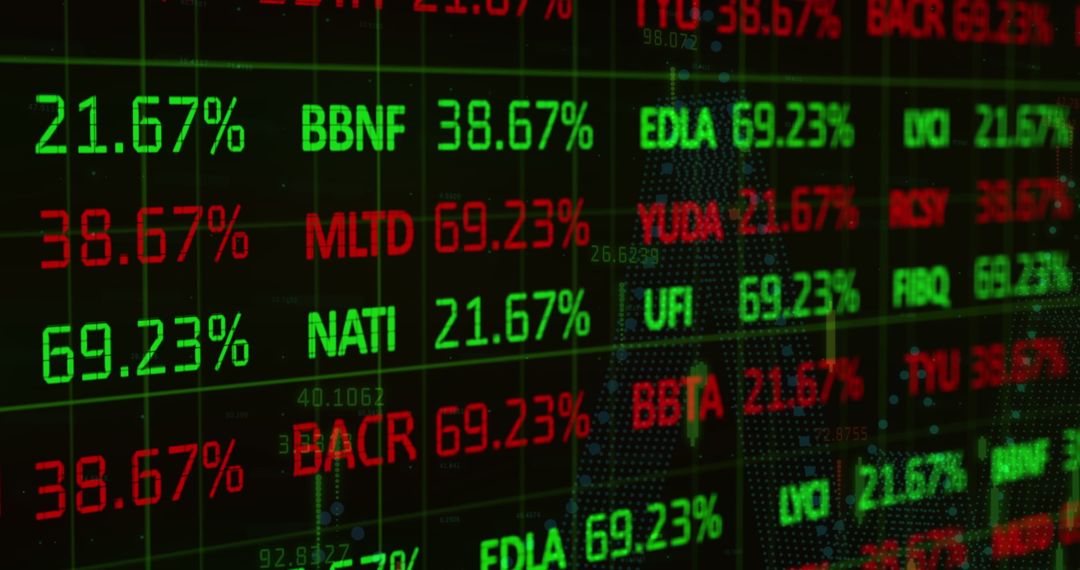
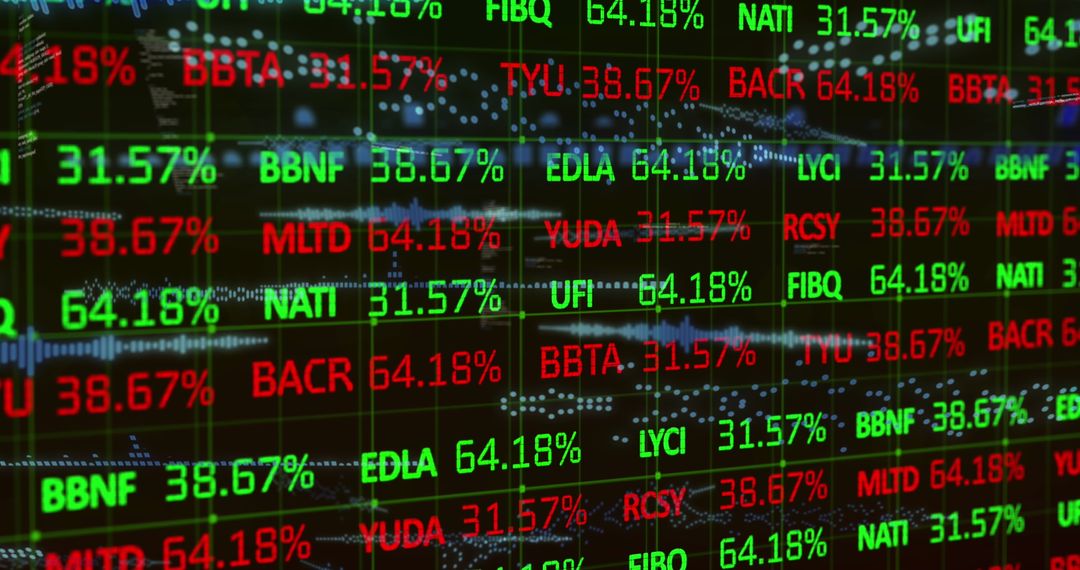
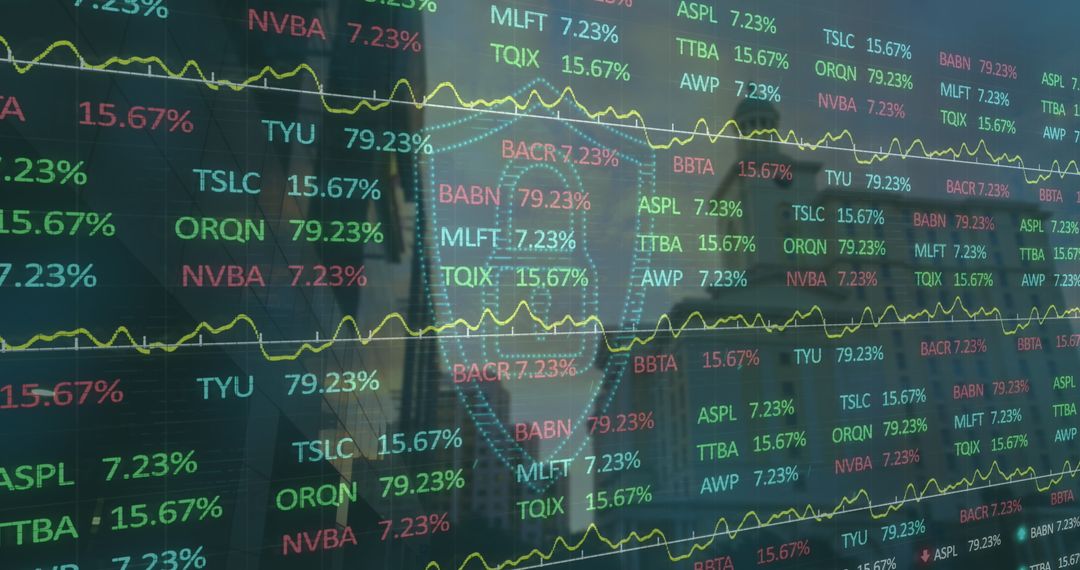
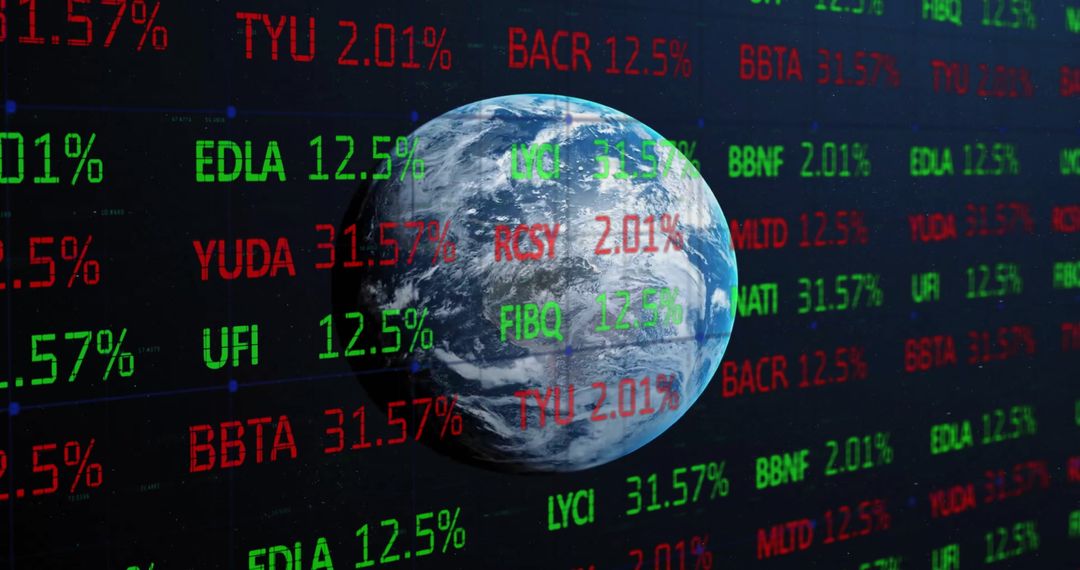
- Global Financial Interface with Stock Market Data Visualization
Global Financial Interface with Stock Market Data Visualization Image

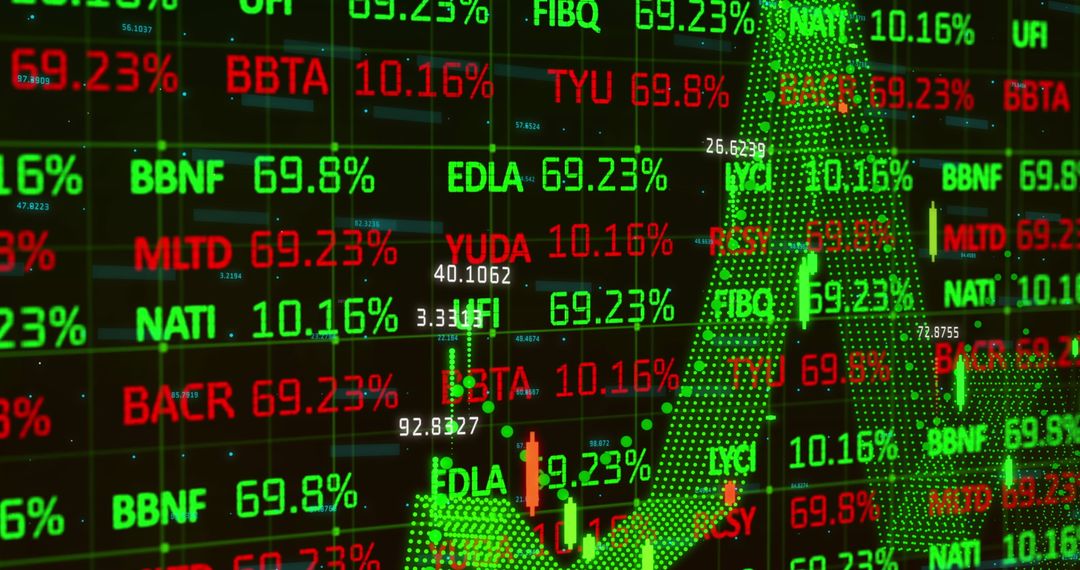
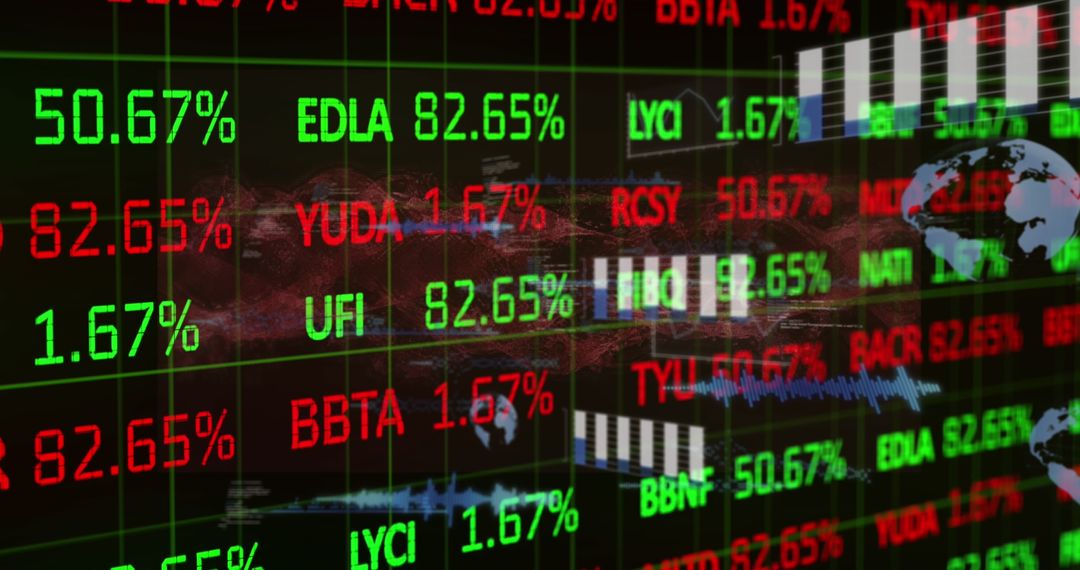
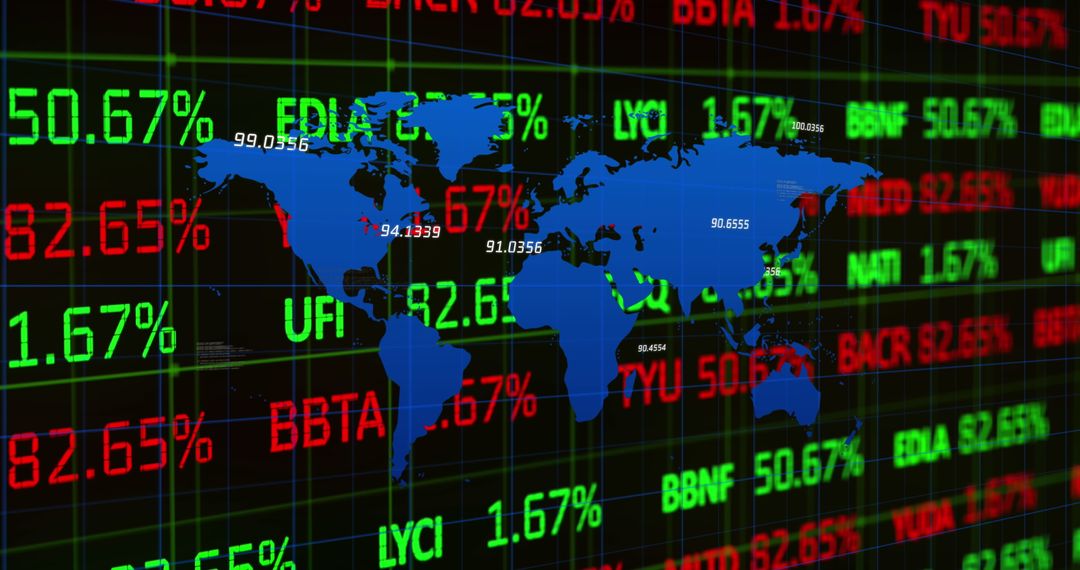
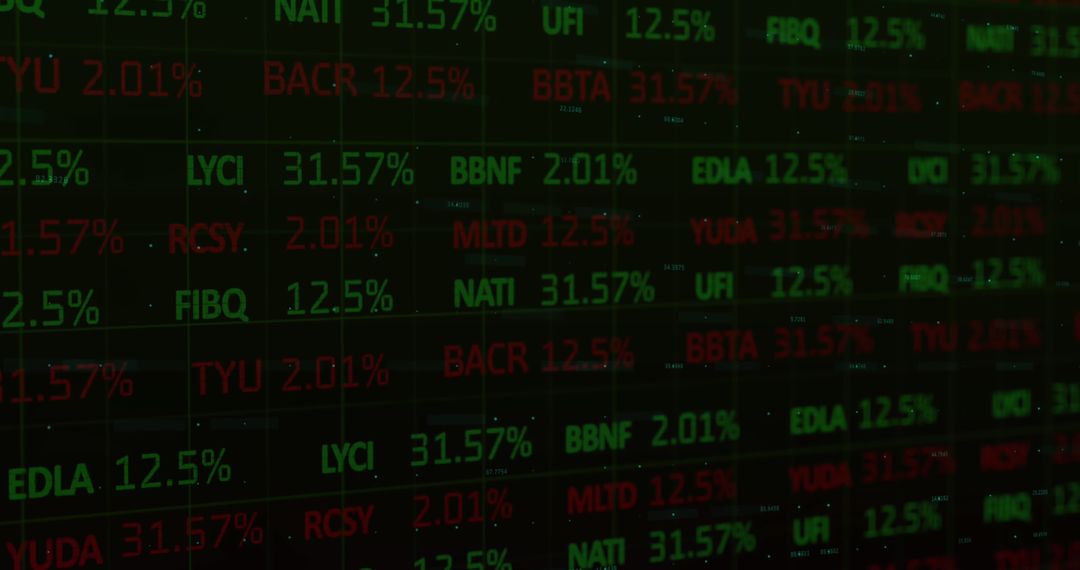
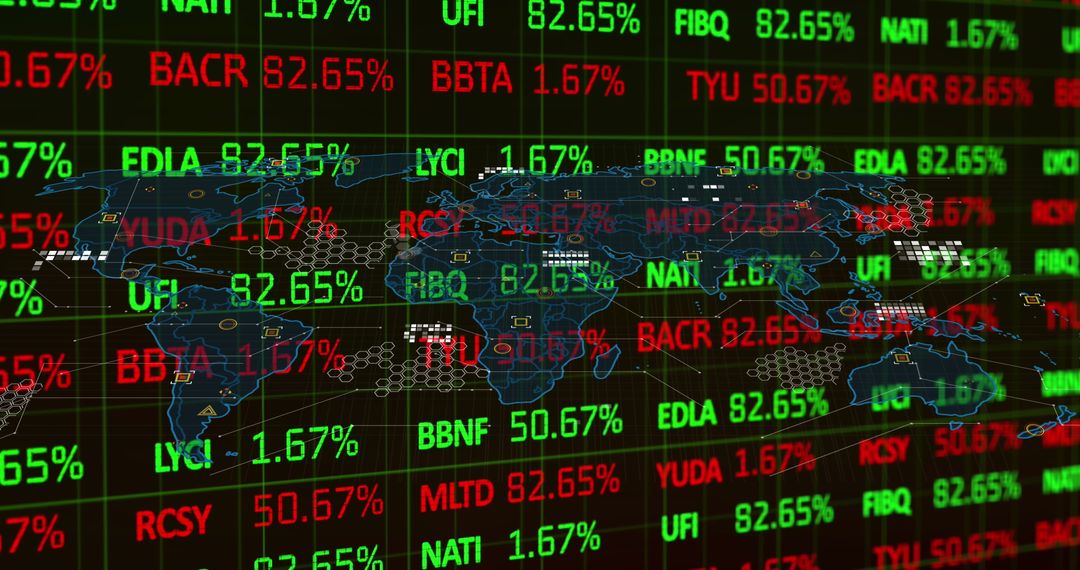
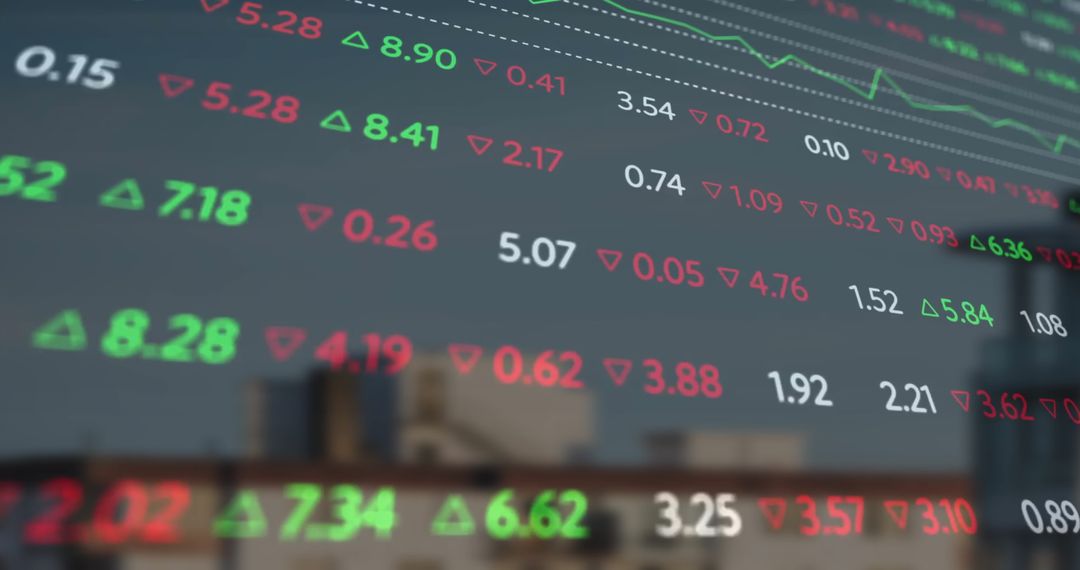
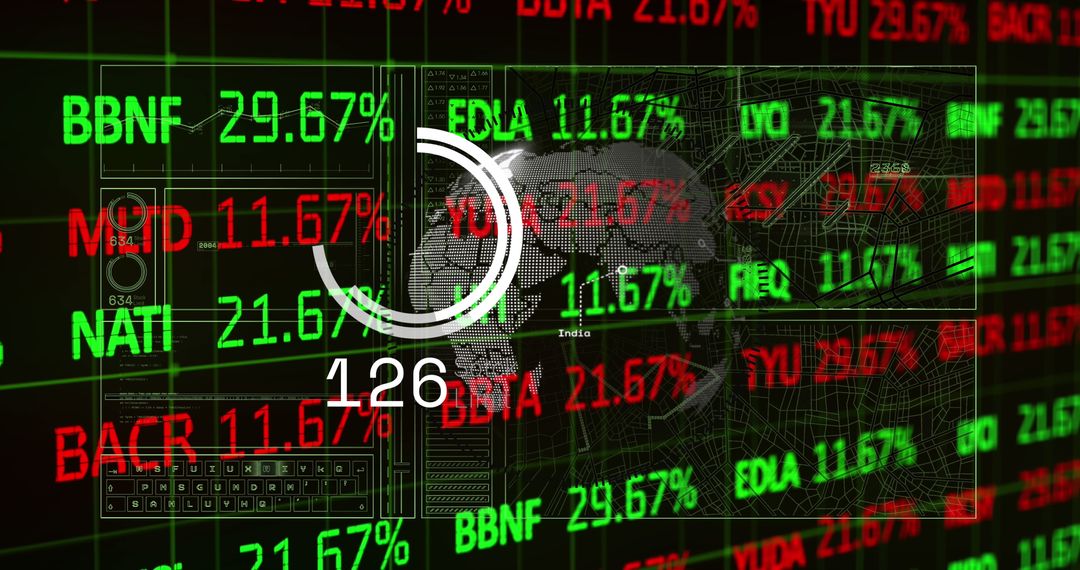
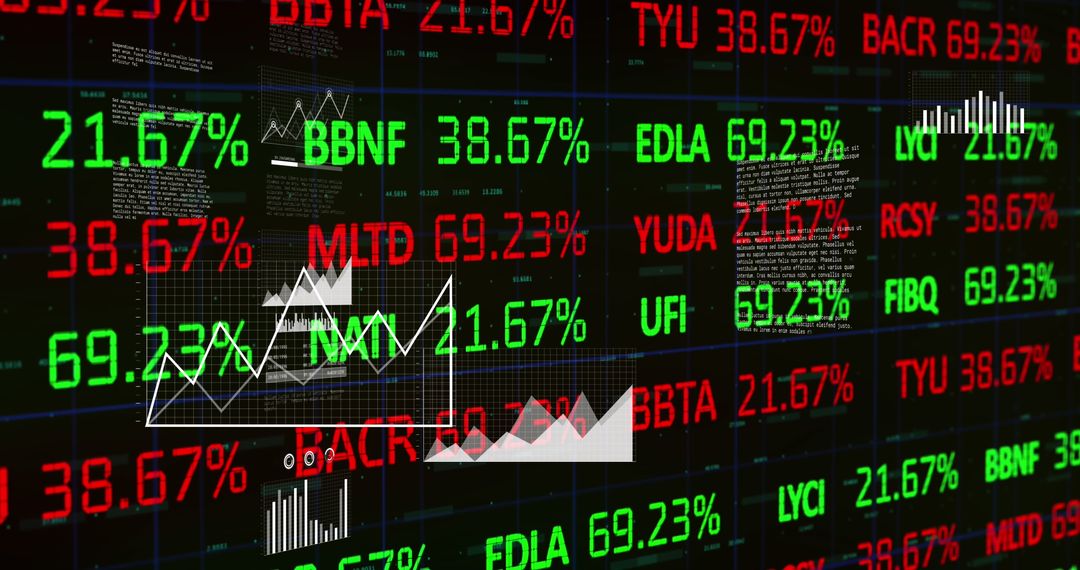
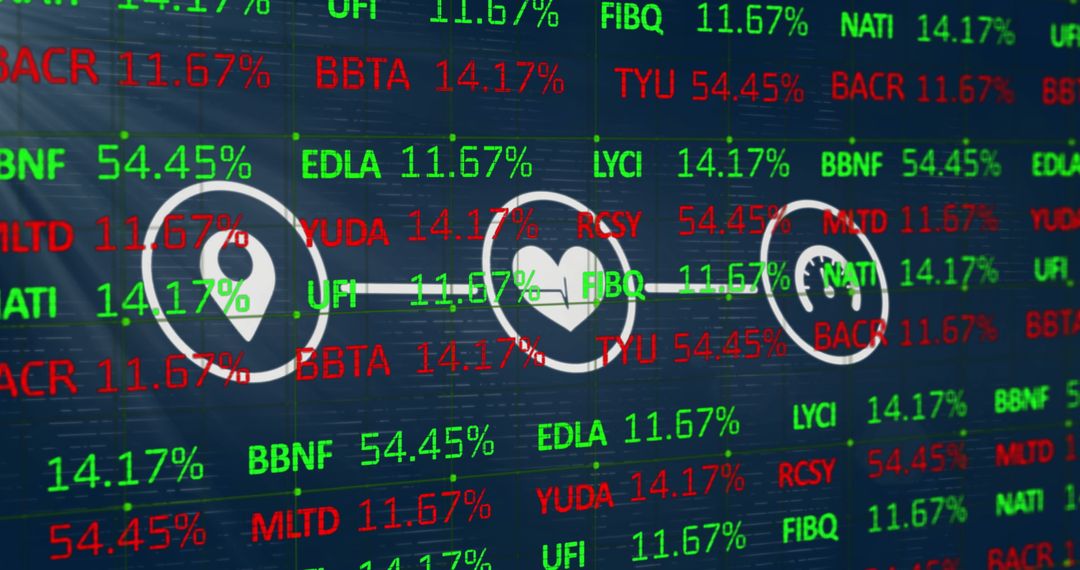
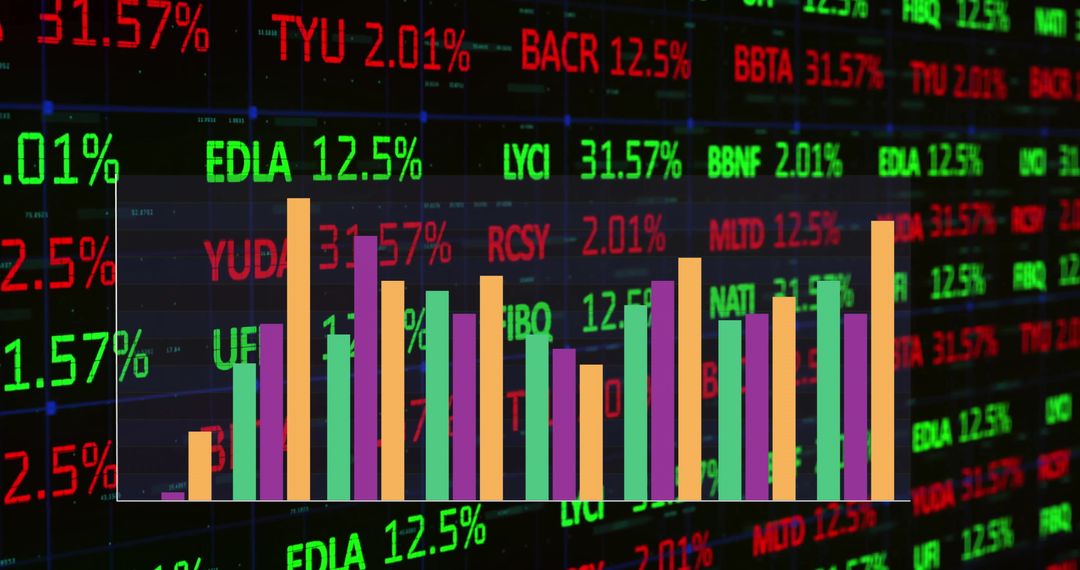
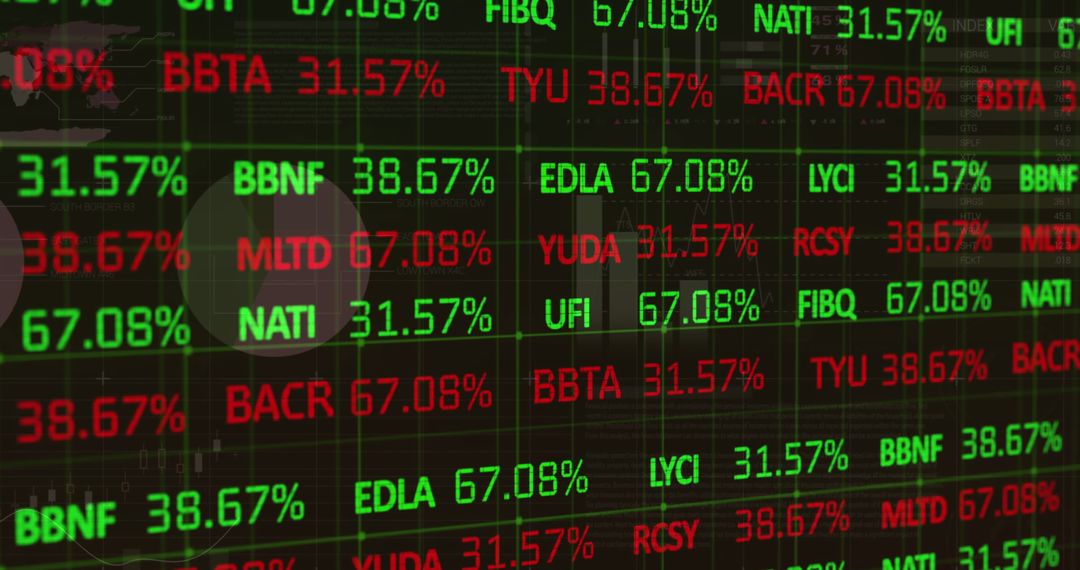
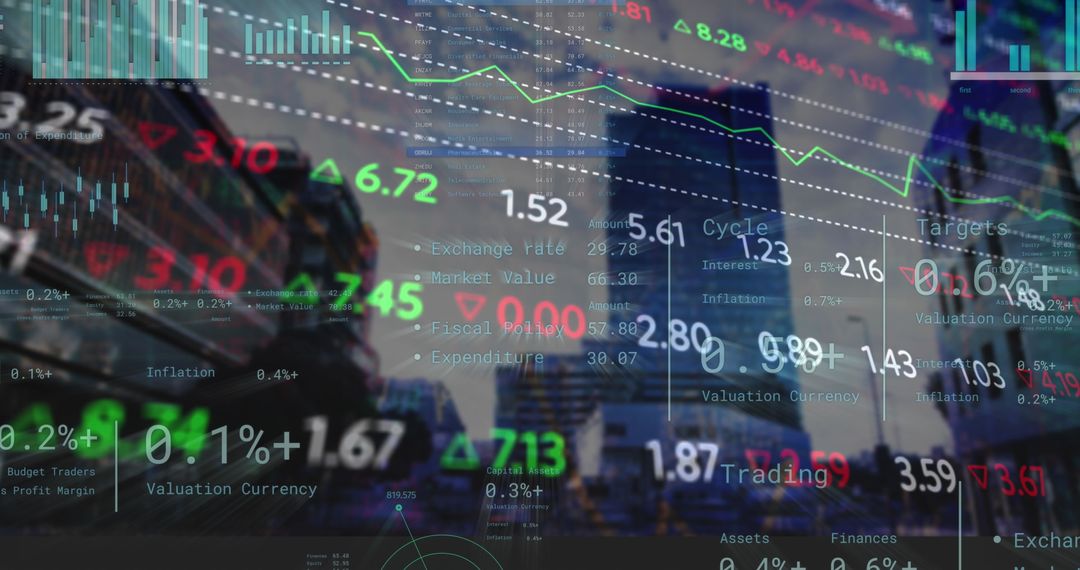
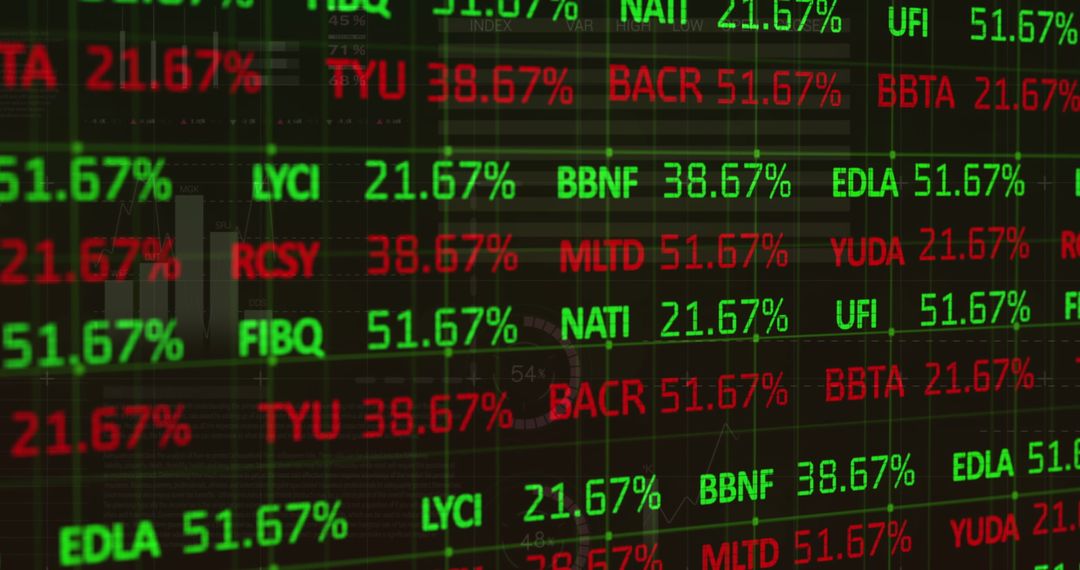
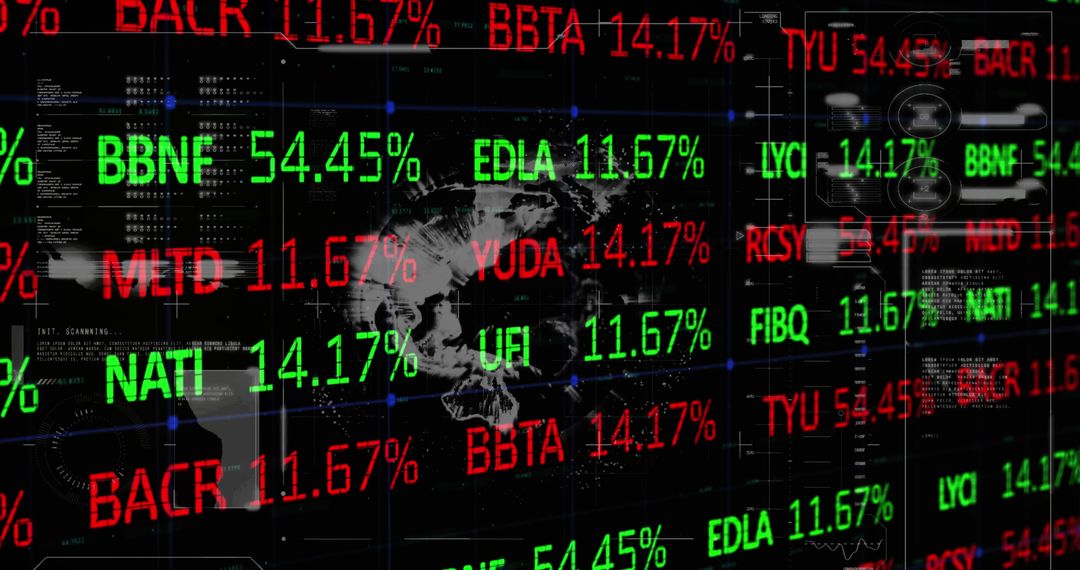
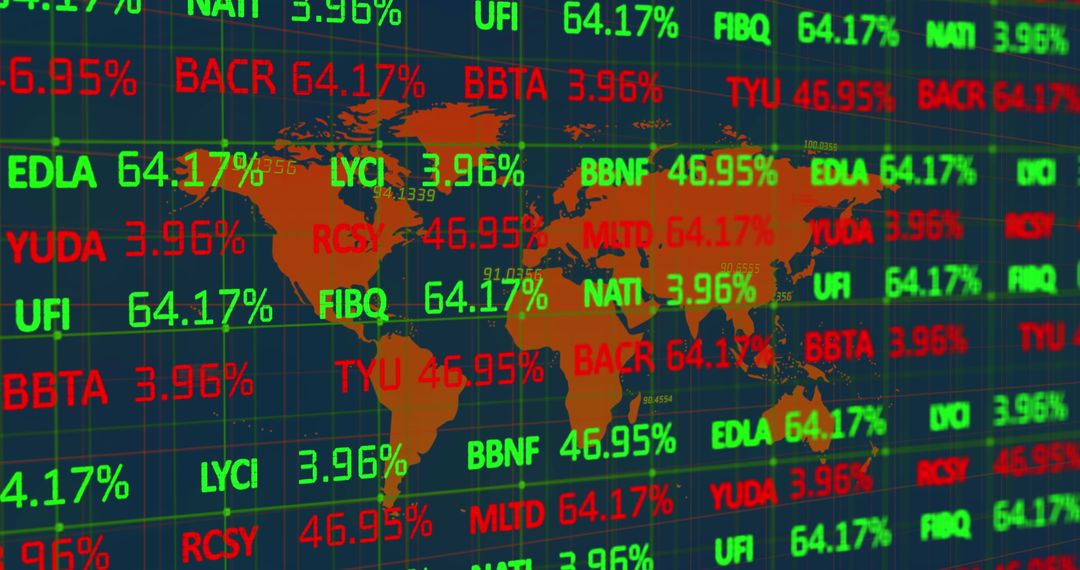
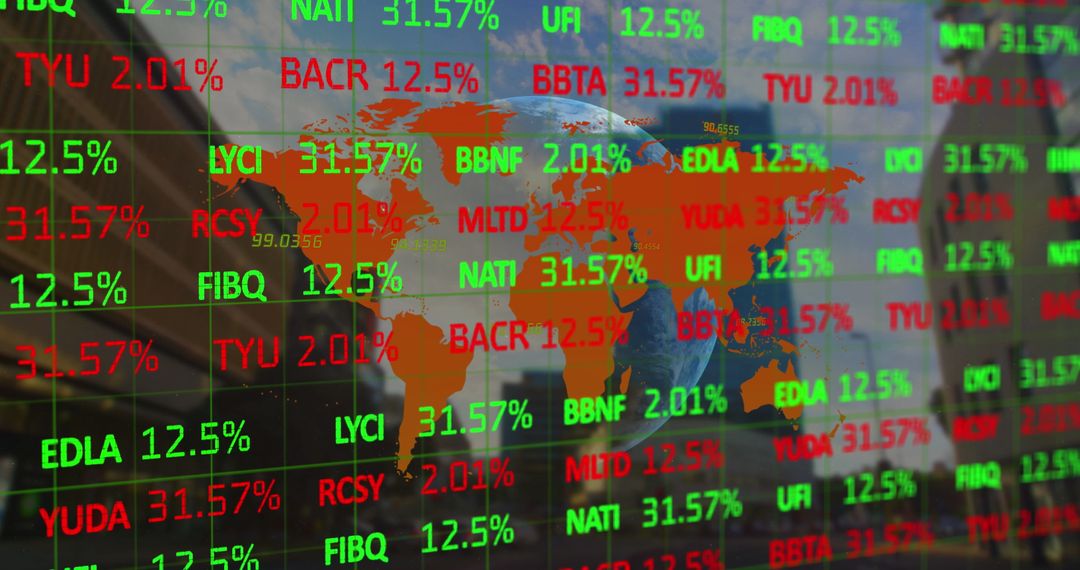
View features bright red and green numbers with world map in background symbolizing financial data and stock market activity. Visually conveys concept of global market insights and data processing related to finance. Ideal for content related to economics, investor insights, international finance markets, analytics, and business technology tools.
Powered by 


2
downloads
downloads
Tags:
More
Credit Photo
If you would like to credit the Photo, here are some ways you can do so
Text Link
photo Link
<span class="text-link">
<span>
<a target="_blank" href=https://pikwizard.com/photo/global-financial-interface-with-stock-market-data-visualization/28f9d507339179d034c73a82a8e8405c/>PikWizard</a>
</span>
</span>
<span class="image-link">
<span
style="margin: 0 0 20px 0; display: inline-block; vertical-align: middle; width: 100%;"
>
<a
target="_blank"
href="https://pikwizard.com/photo/global-financial-interface-with-stock-market-data-visualization/28f9d507339179d034c73a82a8e8405c/"
style="text-decoration: none; font-size: 10px; margin: 0;"
>
<img src="https://pikwizard.com/pw/medium/28f9d507339179d034c73a82a8e8405c.jpg" style="margin: 0; width: 100%;" alt="" />
<p style="font-size: 12px; margin: 0;">PikWizard</p>
</a>
</span>
</span>
Free (free of charge)
Free for personal and commercial use.
Author: Authentic Images
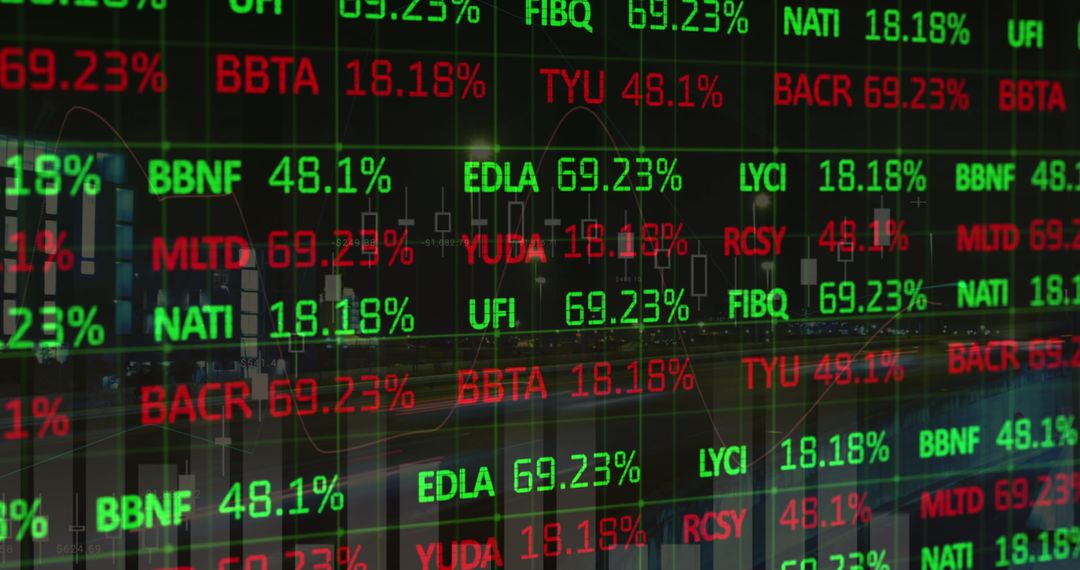
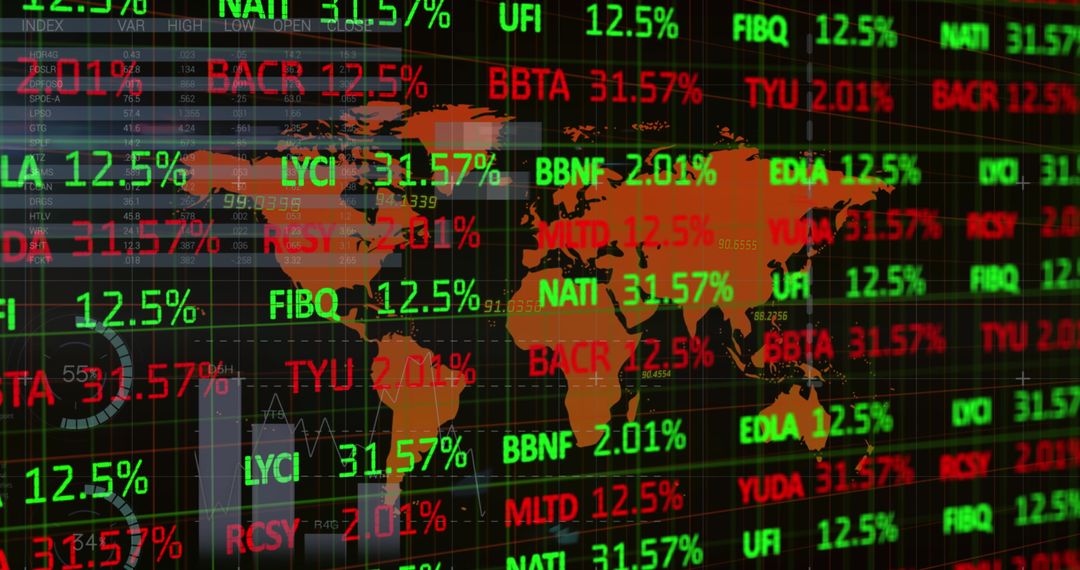
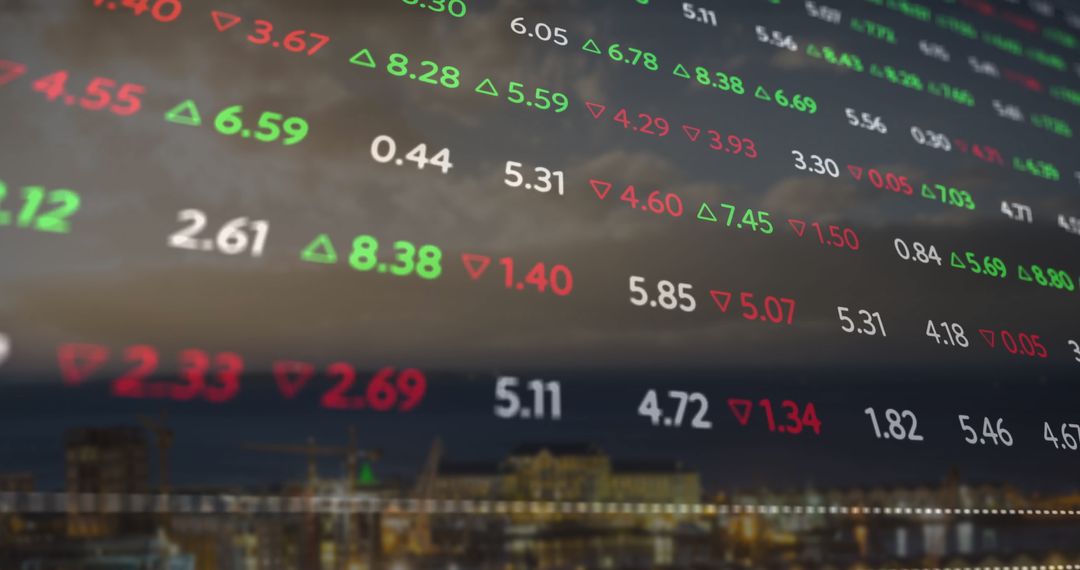
Similar Free Stock Images
Premium


Premium


Premium


Premium


Premium


Premium


Premium


Premium


Premium


Premium


Premium


Premium


Premium


Premium


Premium

Premium


Premium


Premium


Premium


Premium


Premium


Premium


Premium


Premium