
- Home >
- Stock Photos >
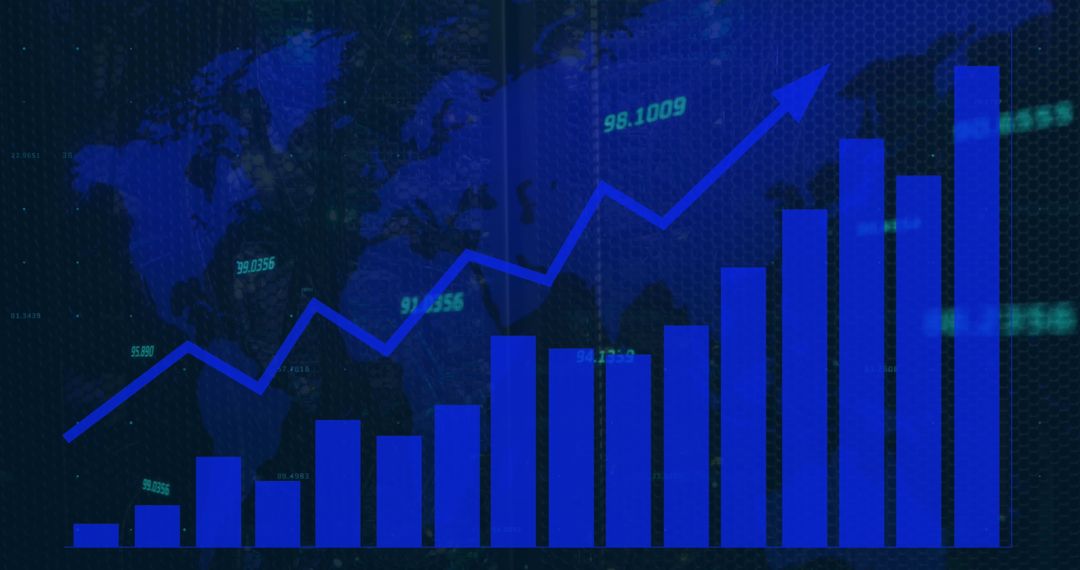
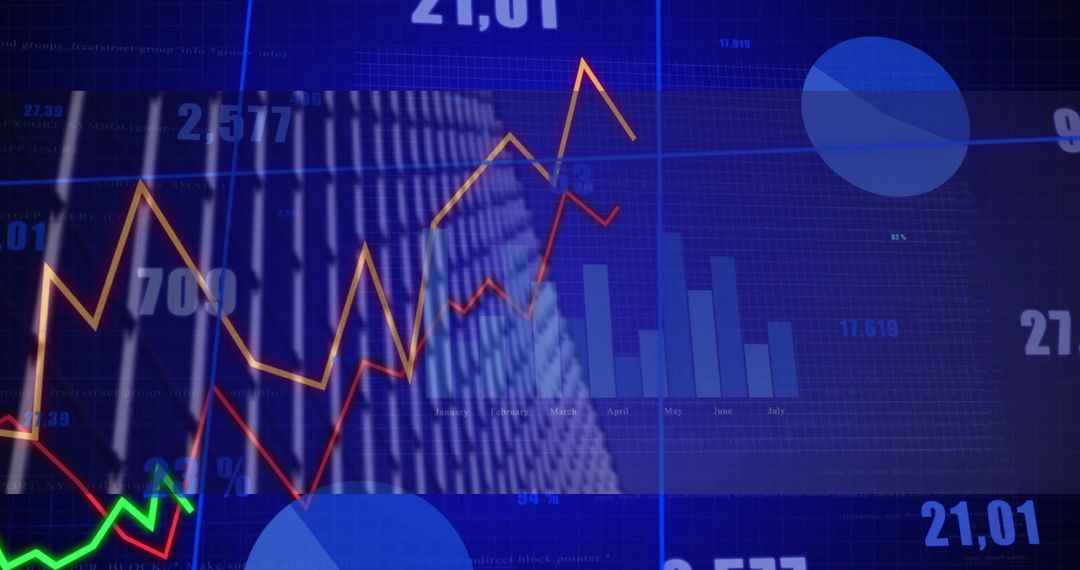
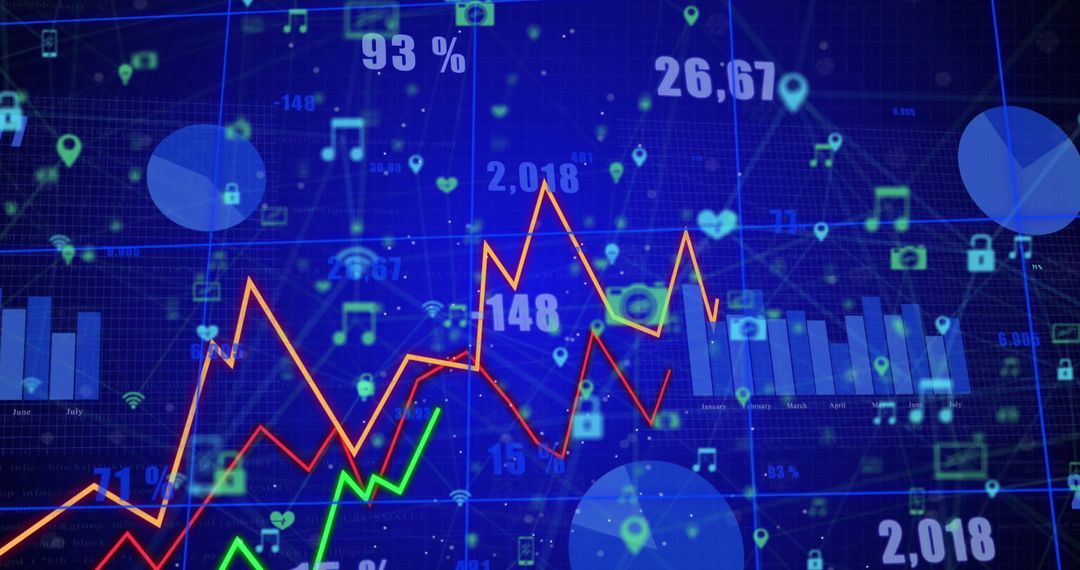
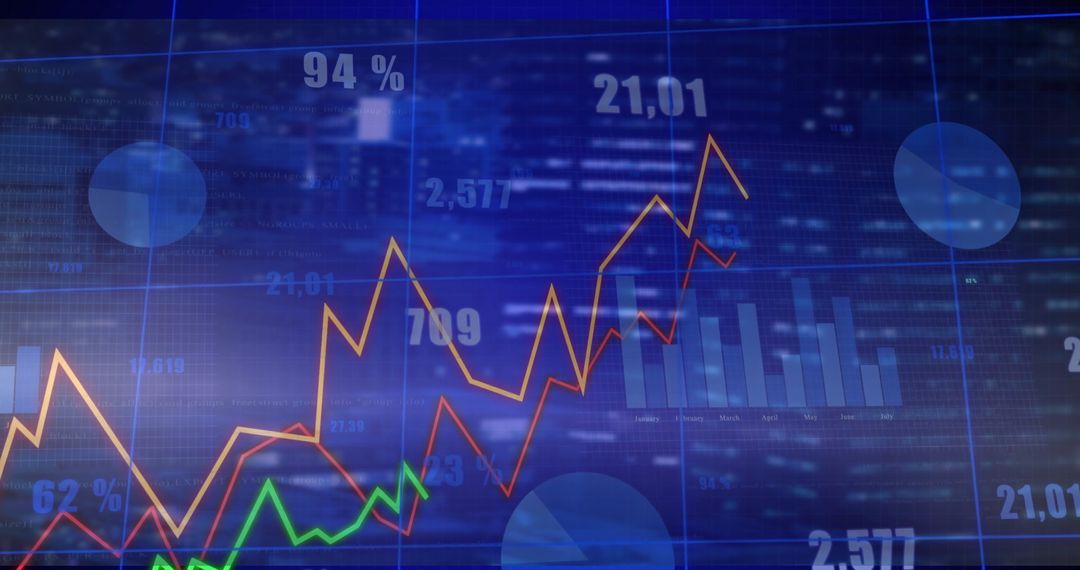
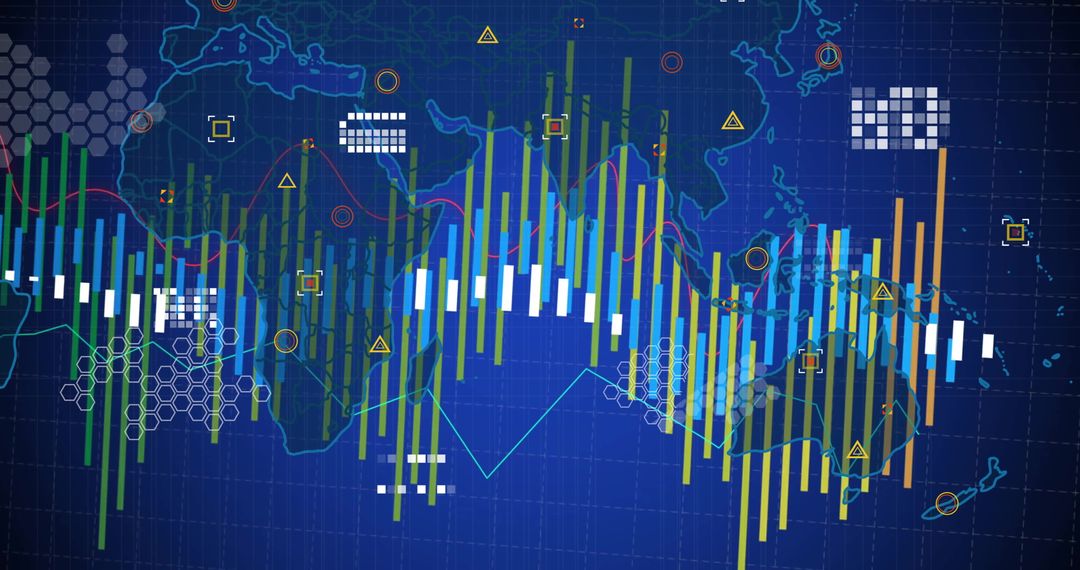
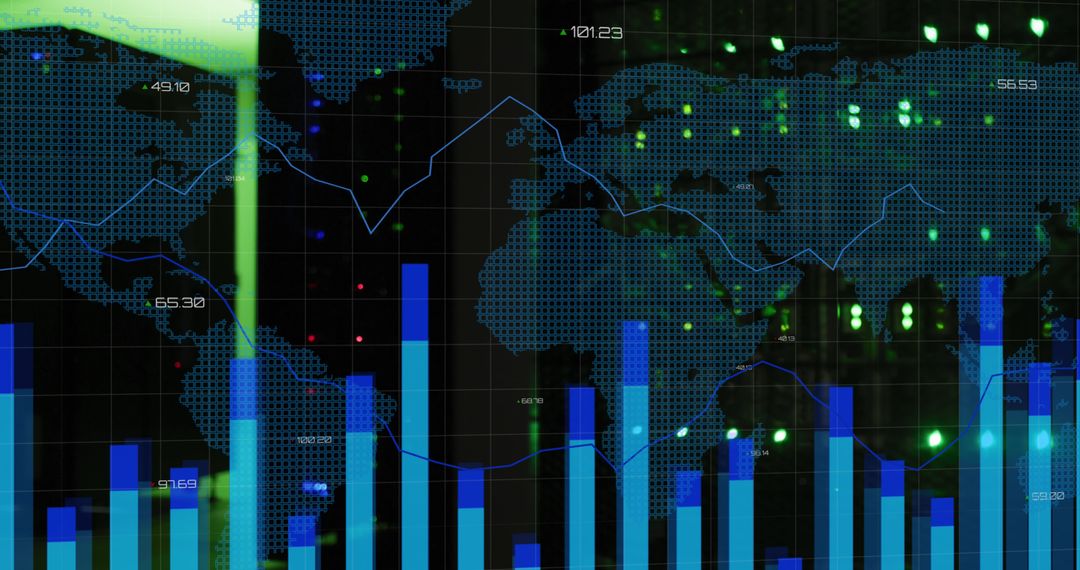
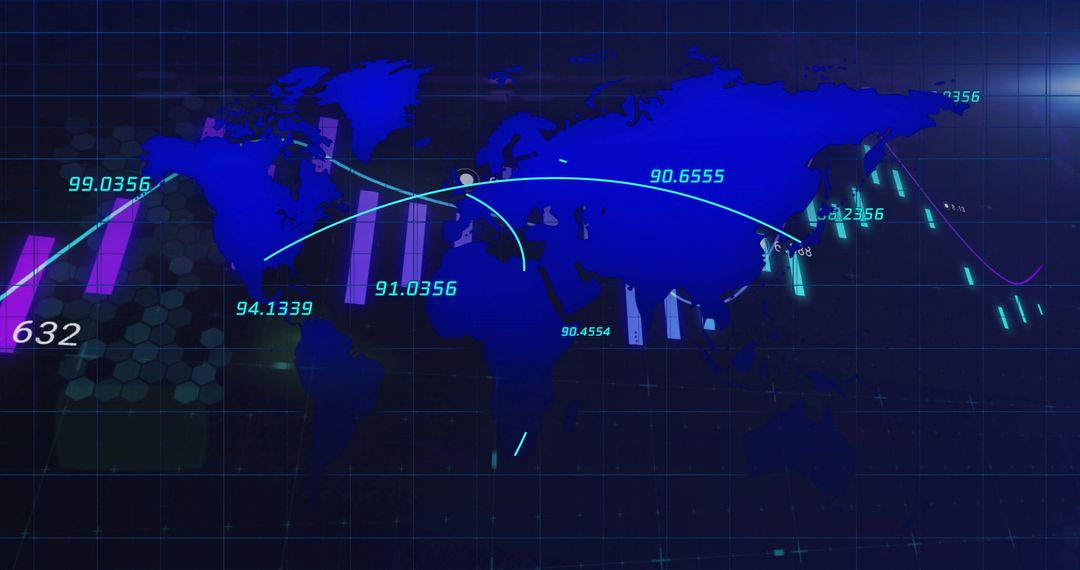
- Global Financial Market Analytics Dashboard Showing Bar Charts and Trend Lines
Global Financial Market Analytics Dashboard Showing Bar Charts and Trend Lines Image

Layered bar charts and colored trend lines displaying over world map grid to convey global market movement. Blue-toned vertical bars representing monthly volumes while orange and red lines tracking price trends and volatility. Numeric labels and gridlines providing clear data context for quick interpretation. Suiting financial reports, investor presentations, market analysis dashboards, fintech product pages, business websites, and marketing campaigns. Allowing overlay of headlines, KPI callouts, and branded colors for custom messaging. Working well as hero graphic for landing pages, slide deck cover, annual report visual, data blog header, or social media ad creative. Offering flexible crop for portrait or banner layouts and high-contrast composition for print or web use.
Powered by  - Get 15% off with code: PIKWIZARD15


0
downloads
downloads
Tags:
More
Credit Photo
If you would like to credit the Photo, here are some ways you can do so
Text Link
photo Link
<span class="text-link">
<span>
<a target="_blank" href=https://pikwizard.com/photo/global-financial-market-analytics-dashboard-showing-bar-charts-and-trend-lines/57e6a1b02b559b0910a7b65c3cc44e56/>PikWizard</a>
</span>
</span>
<span class="image-link">
<span
style="margin: 0 0 20px 0; display: inline-block; vertical-align: middle; width: 100%;"
>
<a
target="_blank"
href="https://pikwizard.com/photo/global-financial-market-analytics-dashboard-showing-bar-charts-and-trend-lines/57e6a1b02b559b0910a7b65c3cc44e56/"
style="text-decoration: none; font-size: 10px; margin: 0;"
>
<img src="https://pikwizard.com/pw/medium/57e6a1b02b559b0910a7b65c3cc44e56.jpg" style="margin: 0; width: 100%;" alt="" />
<p style="font-size: 12px; margin: 0;">PikWizard</p>
</a>
</span>
</span>
Free (free of charge)
Free for personal and commercial use.
Author: People Creations
Similar Free Stock Images

Premium


Premium


Premium


Premium


Premium


Premium


Premium


Premium


Premium


Premium


Premium


Premium


Premium


Premium


Premium


Premium


Premium


Premium


Premium


Premium


Premium


Premium


Premium


Premium

