
- Home >
- Stock Photos >
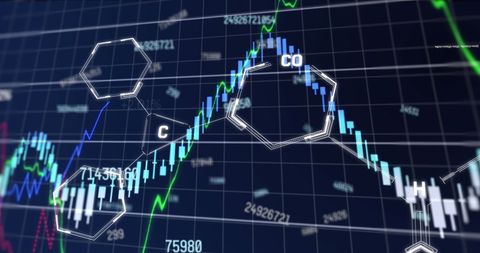
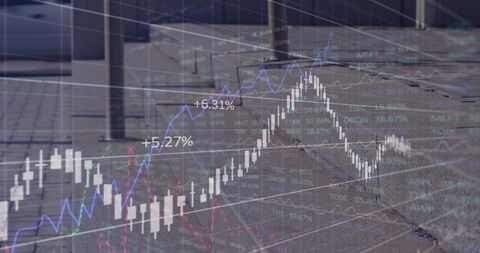
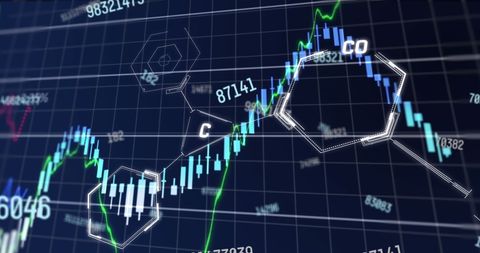
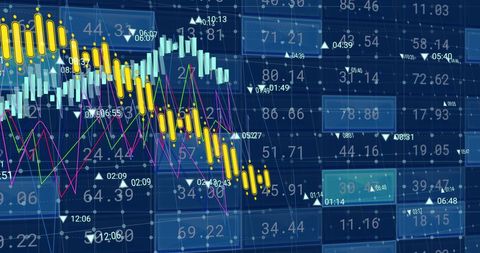
- Global Financial Market Dashboard Showing Candlestick Charts, Percent Labels, Indicators
Global Financial Market Dashboard Showing Candlestick Charts, Percent Labels, Indicators Image

Digital dashboard showing candlestick charts overlaid on world map with colored trend lines, percent labels, heatmap zones, and indicator panels. Design presenting high-tech financial data visualization suitable for global trading, market analysis, investment strategy, and economic forecasting. Suggested uses: Enhancing website hero banners, upgrading corporate presentations, illustrating market analysis reports, supporting fintech product pages, enriching investment research materials, creating social media posts and marketing assets. Color palette and layered elements offering strong focal point for headlines, dashboards, blog headers, landing pages, and pitch decks.
Powered by  - Get 15% off with code: PIKWIZARD15


0
downloads
downloads
Tags:
More
Credit Photo
If you would like to credit the Photo, here are some ways you can do so
Text Link
photo Link
<span class="text-link">
<span>
<a target="_blank" href=https://pikwizard.com/photo/global-financial-market-dashboard-showing-candlestick-charts-percent-labels-indicators/fc2bf61f817c6c24762c555519efeac2/>PikWizard</a>
</span>
</span>
<span class="image-link">
<span
style="margin: 0 0 20px 0; display: inline-block; vertical-align: middle; width: 100%;"
>
<a
target="_blank"
href="https://pikwizard.com/photo/global-financial-market-dashboard-showing-candlestick-charts-percent-labels-indicators/fc2bf61f817c6c24762c555519efeac2/"
style="text-decoration: none; font-size: 10px; margin: 0;"
>
<img src="https://pikwizard.com/pw/medium/fc2bf61f817c6c24762c555519efeac2.jpg" style="margin: 0; width: 100%;" alt="" />
<p style="font-size: 12px; margin: 0;">PikWizard</p>
</a>
</span>
</span>
Free (free of charge)
Free for personal and commercial use.
Author: Awesome Content
Similar Free Stock Images
Loading...

Premium


Premium


Premium


Premium


Premium


Premium


Premium


Premium


Premium


Premium


Premium


Premium


Premium


Premium


Premium


Premium


Premium

Premium


Premium


Premium


Premium


Premium


Premium


Premium


Premium


