
- Home >
- Stock Photos >
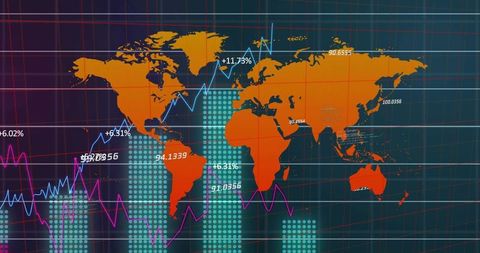
- Global Financial Markets and Technology Analysis
Global Financial Markets and Technology Analysis Image

This design depicts a complex network of financial data over a world map, suitable to represent global market analysis or technology investment prospects. Useful for illustrating economic trends, presentations on global finance, or educational materials on international trade.
Powered by  - Get 15% off with code: PIKWIZARD15


2
downloads
downloads
Tags:
More
Credit Photo
If you would like to credit the Photo, here are some ways you can do so
Text Link
photo Link
<span class="text-link">
<span>
<a target="_blank" href=https://pikwizard.com/photo/global-financial-markets-and-technology-analysis/42fa1f7cf8b4af0ac56218df3f003eee/>PikWizard</a>
</span>
</span>
<span class="image-link">
<span
style="margin: 0 0 20px 0; display: inline-block; vertical-align: middle; width: 100%;"
>
<a
target="_blank"
href="https://pikwizard.com/photo/global-financial-markets-and-technology-analysis/42fa1f7cf8b4af0ac56218df3f003eee/"
style="text-decoration: none; font-size: 10px; margin: 0;"
>
<img src="https://pikwizard.com/pw/medium/42fa1f7cf8b4af0ac56218df3f003eee.jpg" style="margin: 0; width: 100%;" alt="" />
<p style="font-size: 12px; margin: 0;">PikWizard</p>
</a>
</span>
</span>
Free (free of charge)
Free for personal and commercial use.
Author: People Creations
Similar Free Stock Images
Loading...

Premium


Premium


Premium


Premium


Premium

Premium


Premium

Premium


Premium


Premium

Premium

Premium


Premium

Premium

Premium


Premium


Premium

Premium


Premium

Premium


Premium


Premium


Premium


Premium


Premium
