1. Home > 
  2. Stock Photos > 
  3. Global Financial Markets Data Background with Digital Graphs

Global Financial Markets Data Background with Digital Graphs Image

Global Financial Markets Data Background with Digital Graphs

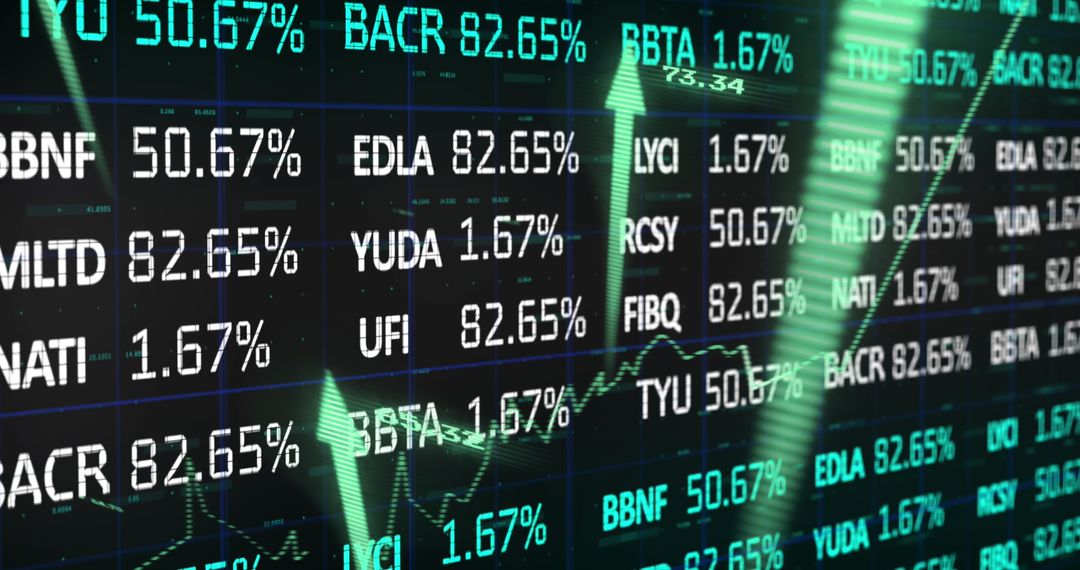
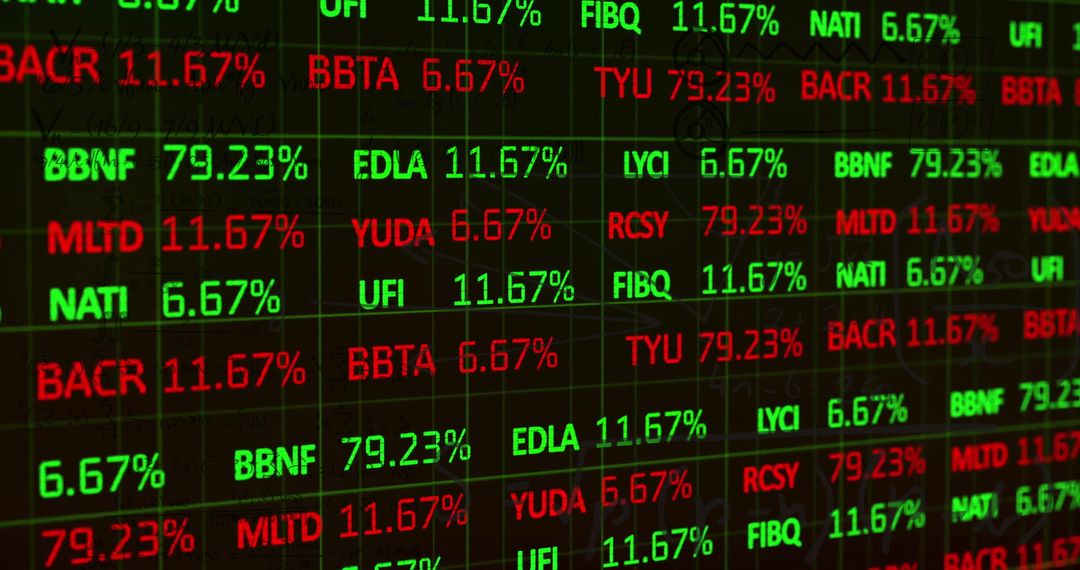
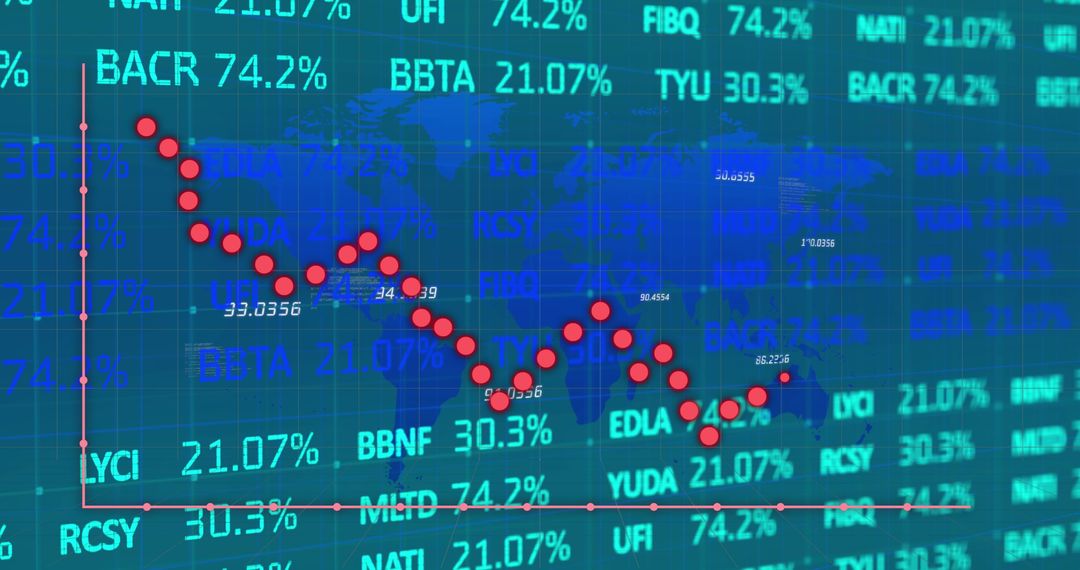
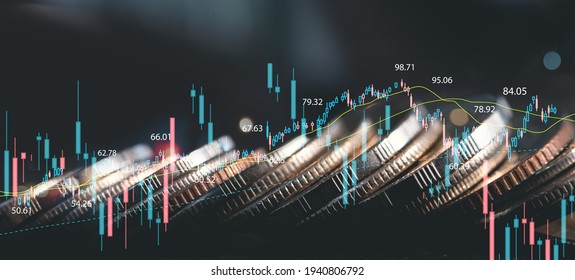
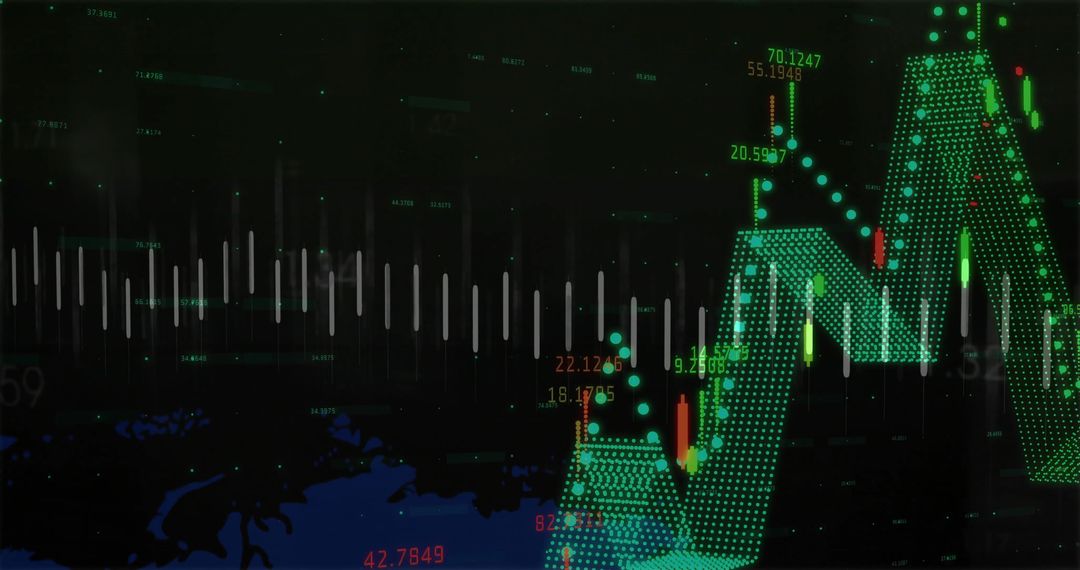
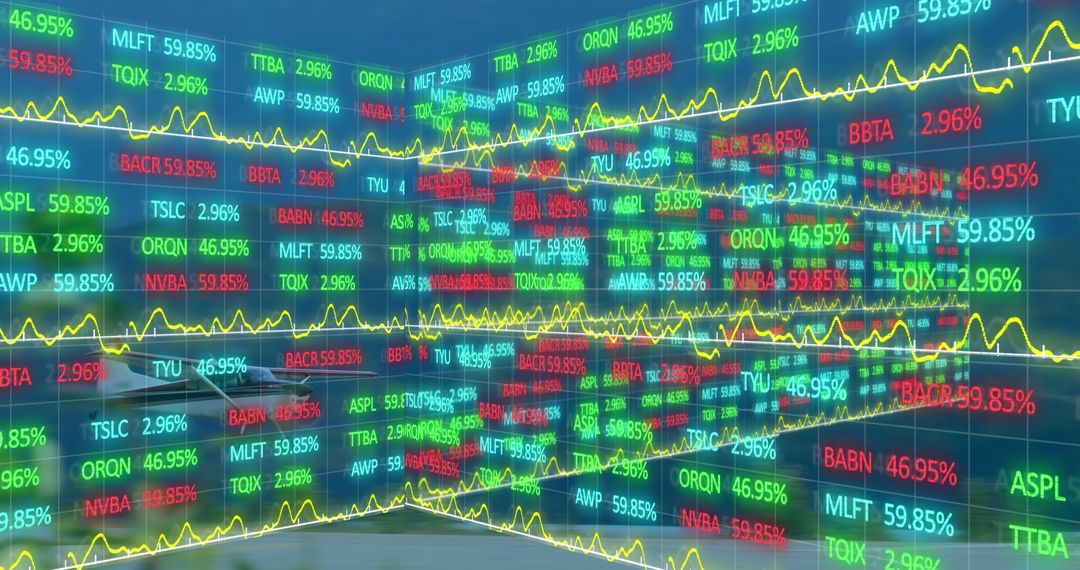
Digital display of stock market trends and financial figures on world map outline. Perfect for technology-themed business presentations, finance-related applications, investment articles, or educational materials focused on economics and market analysis.

Powered by Shutterstock logo - Get 15% off with code: PIKWIZARD15
Analysis finance grow graph and market  investment. Financial  business plan,earnings,sale and strategy. Stock market chart, exchange financial growth diagram. - Powered by Shutterstock - Get 15% off with code: PIKWIZARD15Explore the stock market trends for 2024 with analytical visuals of businessman planning long term investments and future business growth, Navigate towards success with smart strategies. - Powered by Shutterstock - Get 15% off with code: PIKWIZARD15Stock market or forex trading graph on touchscreen,  finance and investment concept. Economy trends for business, financial charts and digits. - Powered by Shutterstock - Get 15% off with code: PIKWIZARD15Financial Expert Reviews Market Projections and Investment Strategies on Computer - Powered by Shutterstock - Get 15% off with code: PIKWIZARD15Magnifying glass and documents with analytics data lying on table,selective focus - Powered by Shutterstock - Get 15% off with code: PIKWIZARD15

Credit Photo

If you would like to credit the Photo, here are some ways you can do so

Free (free of charge)

Free for personal and commercial use.

Author: Awesome Content

Similar Free Stock Images

Colorful Digital Stock Market Graph on Grid Background
Premium
business goals trends 2025. analytical businessperson planning business growth 2025, strategy digital marketing, profit income, economy, stock market trends and business, technical analysis strategy
Green Stock Market Trends with Financial Growth Indicators
Renowned Stock Market Data Analysis with Dynamic Graphs
Digital Data Processing with Virtual Interface in Server Room
Abstract Digital Financial Analytics with Data Visualizations
Premium
Office man finger touch hud, virtual screen with stock market changes, business candlesticks graph chart. Double exposure of blue and white lines, growing numbers, online trading
Abstract Financial Data with Upward Arrows on Digital Background
Dynamic Stock Market Trading with Green Data Graphs
Inflation Graph with Data Code Overlay on Digital Screen
Dynamic Stock Market Display with Trading Data and Graphs
Premium
Growth stock market graph of business investment. Successful business, growth strategy and achieving goals with the rising arrow. Business strategy development and growing growth plan.
Global Data Analytics and Stock Market Visual Interface
Global Stock Market Trends with Digital Interface Concepts
Inflation Impact with Graphs and Data Overlays in Green
Fluctuating Stock Market Prices and Data Display
Premium
2022 business concept, businessman or engineer Show the trend of driving digital currency to develop online business.
Financial Data Overlay on Computer Servers Illustrating Global Business Trends
Fluctuating Stock Market Display with Financial Data and Analytics
Dynamic Data Analysis over Virtual Grid with Neural Patterns
Dynamic Financial Stock Market Display with Analytical Data
Premium
Finance, business, investment, or economy growing graph concept. A man tapping on top of an arrow, analyzed data, as it rising up high. The chart and arrows represening the growth and increase.
Financial Data Analysis Over Green Grid Background
Financial Data Display on Digital Interface
Dynamic Financial Data Display with Technology Concept
Global Data Visualization with Financial Metrics and World Map
Premium
Glowing orange candlestick and line chart set against a dark grid background, symbolizing dynamic stock market trading, investment analytics, financial growth, trend forecasting, and technological mar
Stock Market Volatility Display with Detailed Statistics
Dynamic Stock Market Ticker with Pricing Data and Visual Indicators
Rising Market Trends with Green Line Graph and Arrow Indicators
Futuristic Digital Finance Market Trend Visual
Futuristic Stock Market Graph with Digital Data
Global Financial Data Network Interface Concept Visualization
Premium
Stockmarket online trading chart candlestick on crypto currency platform. Stock exchange financial market price candles graph data pattern analysis concept. Computer screen closeup background
Digital Data and Cloud Computing with Green Light Effects
Financial Data Visualization on Server Background
Financial Data Overlaid on Empty Warehouse Illustrating Market Dynamics
Global Stock Market Analysis with Digital Interface
Premium
Businessman Drawing Upward Arrow on Digital Stock Market Graph with Trading Data, Buy and Sell Indicators, Representing Financial Growth, Investment Success Foreign currency trading and Forex Trading
Analyzing Dynamic Financial Data with Green Stock Market Trends
Digital Stock Market Display with Rising Graph and Arrows
Financial Data Analysis Amidst Global Fluctuations
Digital Fintech Interface with Global Business Network
Premium
business goals trends 2024. analytical businessperson planning business growth 2024, strategy digital marketing, profit income, economy, stock market trends and business, technical analysis strategy
Stagflation Concept with Fluctuating Financial Graph and Data
Financial Data Overlay on Urban Construction Background
Colorful Stock Market Data with Infographics
Financial Data Screen Displaying Stock Market Tickers and Graph
Premium
Digital economic growth chart with a rising trend towards 2025, symbolizing future market predictions.
Dynamic Financial Data and Stock Market Analysis
Dynamic Financial Data Display on Electronic Grid
Digital Display of Stock Market Data with Rising Trends
Digital Stock Exchange Interface with Data Analytics
Premium
Business growing in 2025. Analytical businessman planning business growth 2025, strategy digital marketing, profit income, economy, stock market trends and business
Financial Data Analysis Overlaying Cityscape
Stock Market Analysis with Global Data Visualization
Analyzing Financial Data with Business Charts Against Urban Skyline
Fluctuating Stock Index with Confidence Building Trends
Premium
Businessman finger touch hud, virtual screen with stock market changes, business graph chart. Double exposure of coloured lines, growing numbers, online trading
Financial Data Visualization with Digital Pulse and Charts
Financial Market Data with Stock Candlestick Chart and Indicators
Displaying Neon 3D Dotted Financial Chart with Candlesticks, Numeric Labels, Analytics
Digital Financial Market Data Visualization
Global Financial Data Visualization with Technical Analysis
Digital Green Financial Markets with Cryptocurrency Trends
Premium
Man look at the dashboard with graphs and charts. Concept of data management system, business intelligence, data statistics, marketing analysis, key performance indicators (KPI) and analytics.
Abstract Global Financial Data and Digital Trading Interface
Dynamic Digital Financial Data Chart Visualization
Stock Market Data Financial Analysis Technology
Financial Data and Statistics Display with Rising Arrows
Premium
Stock market chart, exchange financial growth diagram.Analysis finance grow graph and market investment. Financial business plan,earnings,sale and strategy.
Falling Stock Market Graph with Data on Black Screen
Digital Data Streams with Statistics Display
Financial Data Processing and Social Media Overlaid on Globe
Digital Interface with Stock Market Data on Globe
Premium
Business finance and investment, world economic growth concept. Forex financial graph chart, market report on cash currency with copy space for business and finance background
Digital Display of Stock Market Data and Graphs
Digital Financial Data Display with Stock Trends and Graph
Dynamic Digital Financial Charts Overlaid with Traditional Dashboard Elements
Abstract Data Visualization Overlaying Urban Cityscape
Premium
Man look at the dashboard with graphs and charts. Concept of data management system, business intelligence, data statistics, marketing analysis, key performance indicators (KPI) and analytics.
Futuristic Digital Network with Data Streams and Connections
Dynamic Financial Data with Graph Trends and Statistics
Financial Data with Statistics and Market Trends Overlay
Dynamic Stocks and Trading Data Visualization
Premium
Older businessman analyzing financial charts on two smartphones with a laptop, U.S. flag background, and stock market graphs overlay.
Dynamic Stock Market Graph on Digital Data Screen
Global Financial Data Display on Digital Interface
Stock Market Decline with Red Graph Showing Slump in Financial Markets
Futuristic Data Processing on Digital Interface Concept
Premium
Businessman Holding Virtual Growth Chart with Rising Arrows, Stock Market Trends, concept Financial Success,Business Growth Digital Stock Chart, Investment, Economic Growth, Data Analytics Background
Digital Financial Growth Analysis with Upward Trend
Green Dotted Market Mesh Chart Displaying Candlestick Patterns and Volatility Dashboard
Dynamic Stock Market Data Visual Collage
Stock Market Tickers with Dynamic Graphs on Black Background
Cybersecurity Data Analysis and Encrypted Connections
Abstract Digital Data Chart on Computer Server Background
Premium
Business strategy development and growing growth plan.	
Financial management strategy for business growth.Graph and chart. Investment of growth on currency rate.
Data Transmission Over Server Room with Digital Overlay
Dynamic Financial Growth Arrow with Data Overlay
Dynamic Digital Graph with Financial Data Trends
Digital Inflation Visualization with Stock Market Data Overlay
Premium
Stock market Investor analyst broker analyzing financial trade crypto stockmarket exchange platform digital chart data on computer screen thinking of investing analytic risk. Over shoulder view.
Green Numbers and Graph Depicting Earning Projections on Electronic Display
Stock Market Graphs Overlaying Urban Cityscape at Dusk
Digital Data Processing with Rising Red Graph Effects
Digital Representation of Slumpflation in Global Economy
Premium
Futuristic Digital Growth Chart – 3D Bar Graph with Glowing Blue Data Visualization
Dynamic Stock Market Data and Digital Interface Concept
Stock Market Numbers Overlay on Airplane Runway Scene
Financial Data Analysis with Declining Trends
Digital Financial Data with Stock Market Indicators
Premium
2024 business planning and strategy concept. Analytical businessman planning business growth 2024, digital marketing, profit income, economy, stock market trends and business, 2024 trend.
Financial Data Overlays Human Brain Concept
Colorful Financial Data Analytics and Global Market Trends
World Map with Digital Financial Data Visualization
Financial Data Overlay on Scrolling Digital Stock Market Data
Premium
Businessman works on laptop Showing 2024 business trends dashboard with charts, metrics,  AI, E-commerce, KPI. analytical businessperson planning business growth 2024. New Year Future business tech.
Advanced Financial Data Network Over World Map
Digital Stock Market Display with Data Analysis Graphics
Financial Data with Molecular Background Concept
Trading Desk Screen with Stock Ticker Symbols Current Trends
Premium
Blurred background of high-technology trading floor with multiple monitors displaying stock market data and financial information in a busy trading environment
Neon Green Stock Ticker Display Showing Live Percentages, Line Charts and Grid Data