
- Home >
- Stock Photos >
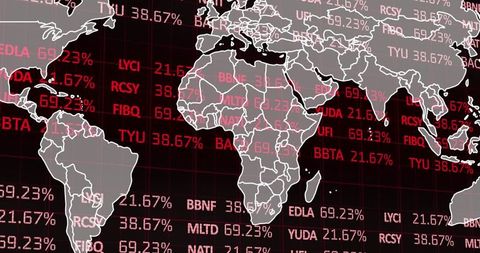
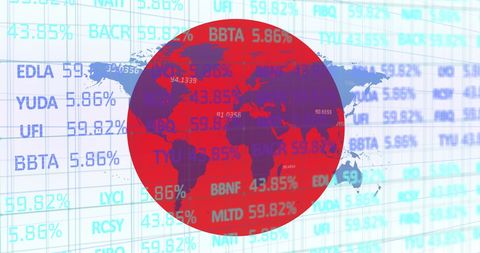
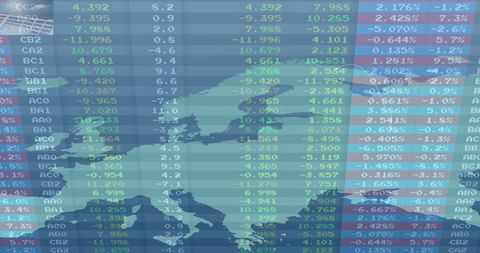
- Global Financial Markets Overlaid on World Map Showcasing Stock Data
Global Financial Markets Overlaid on World Map Showcasing Stock Data Image

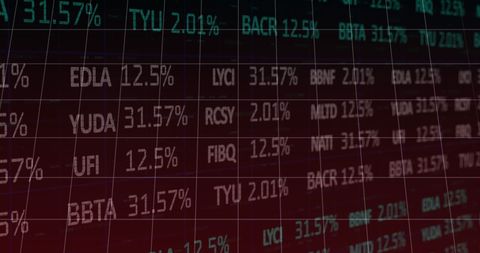
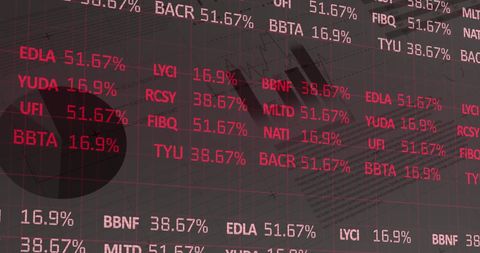
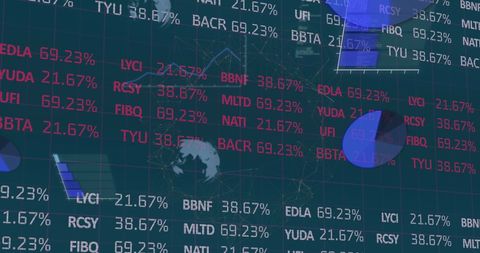
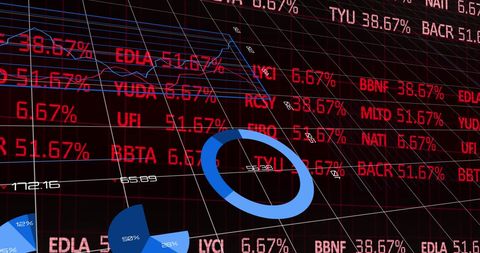
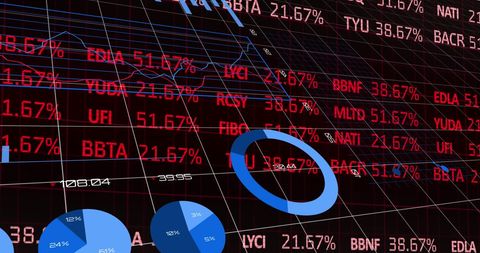
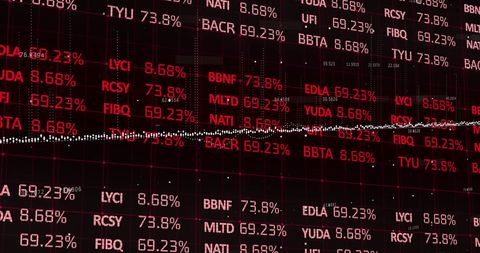
Visual captures essence of global financial markets with dynamic stock data against a world map backdrop. Useful for illustrating articles on finance, economic trends, data analytics, or global investments. Highlights intricate connections of international stock exchanges and financial trading.
Powered by  - Get 15% off with code: PIKWIZARD15


downloads
Tags:
More
Credit Photo
If you would like to credit the Photo, here are some ways you can do so
Text Link
photo Link
<span class="text-link">
<span>
<a target="_blank" href=https://pikwizard.com/photo/global-financial-markets-overlaid-on-world-map-showcasing-stock-data/640696736ecae72ea6c2ef5583d6ca7c/>PikWizard</a>
</span>
</span>
<span class="image-link">
<span
style="margin: 0 0 20px 0; display: inline-block; vertical-align: middle; width: 100%;"
>
<a
target="_blank"
href="https://pikwizard.com/photo/global-financial-markets-overlaid-on-world-map-showcasing-stock-data/640696736ecae72ea6c2ef5583d6ca7c/"
style="text-decoration: none; font-size: 10px; margin: 0;"
>
<img src="https://pikwizard.com/pw/medium/640696736ecae72ea6c2ef5583d6ca7c.jpg" style="margin: 0; width: 100%;" alt="" />
<p style="font-size: 12px; margin: 0;">PikWizard</p>
</a>
</span>
</span>
Free (free of charge)
Free for personal and commercial use.
Author: People Creations
Similar Free Stock Images
Loading...

Premium


Premium

Premium


Premium


Premium

Premium


Premium


Premium


Premium


Premium

Premium


Premium


Premium


Premium


Premium


Premium


Premium


Premium


Premium


Premium


Premium


Premium


Premium

Premium


Premium
