- Home >
- Stock Photos >
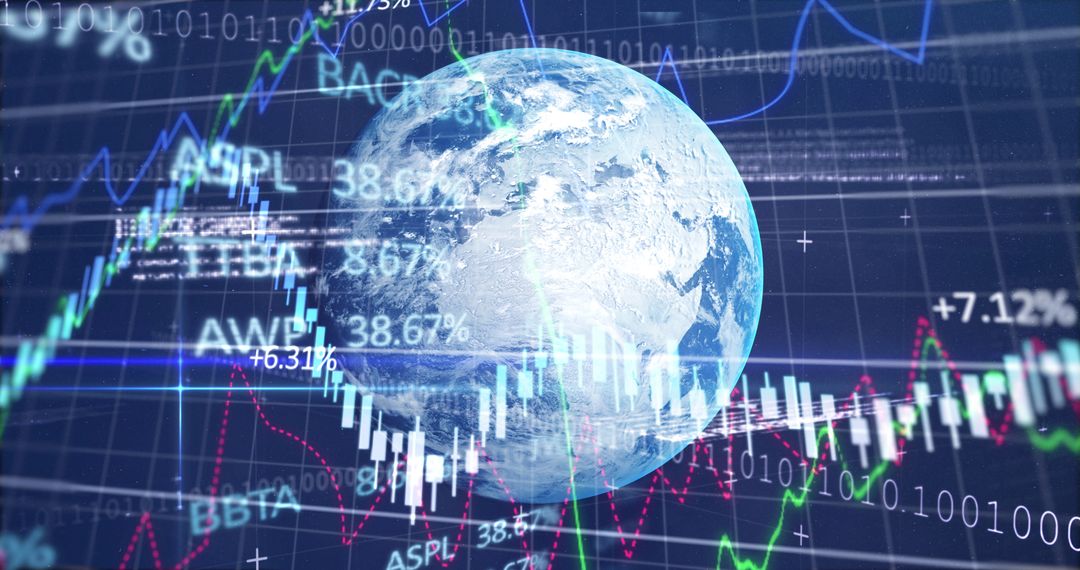
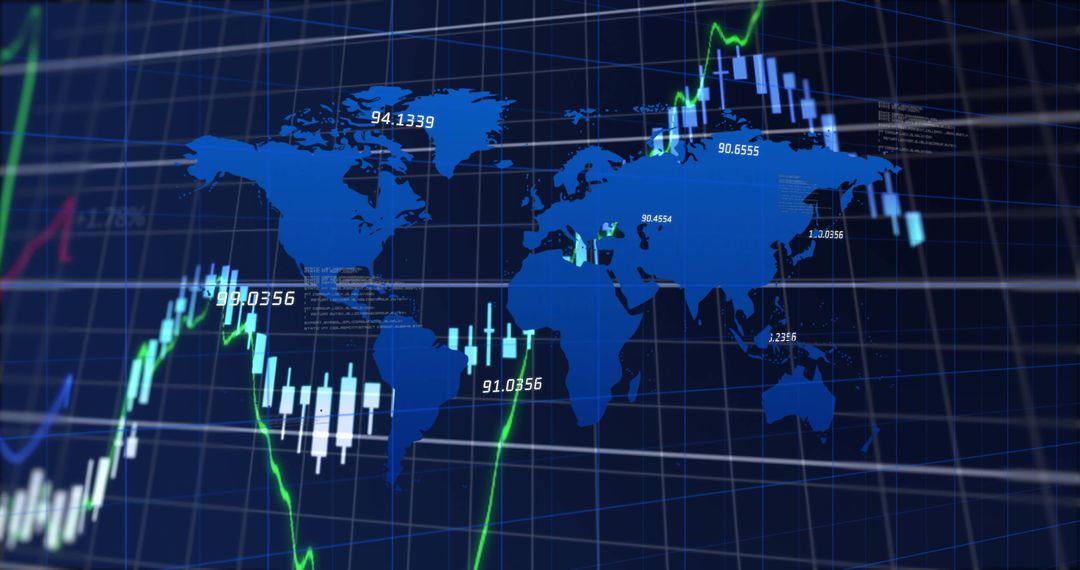
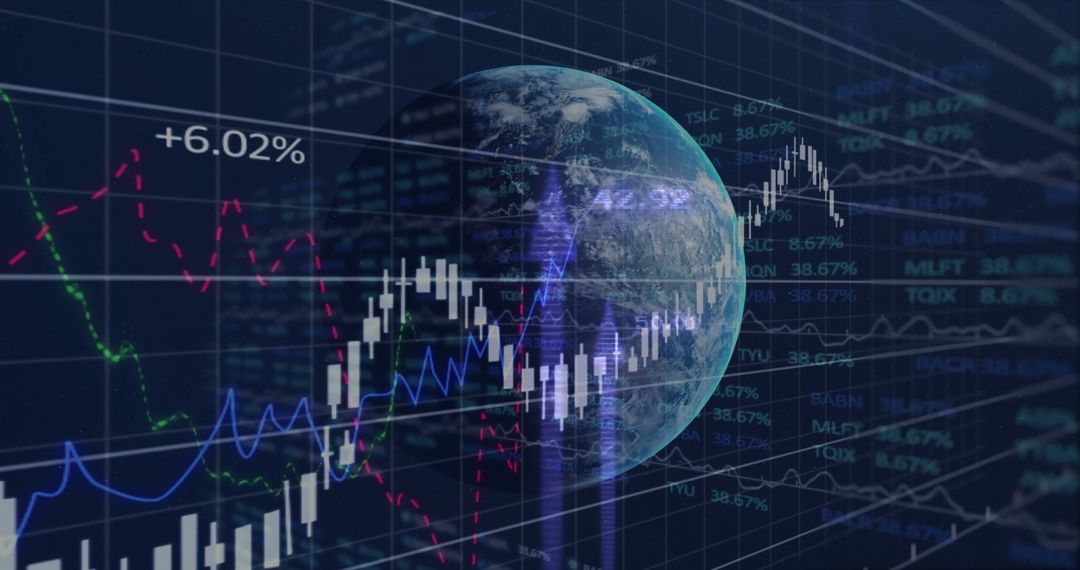
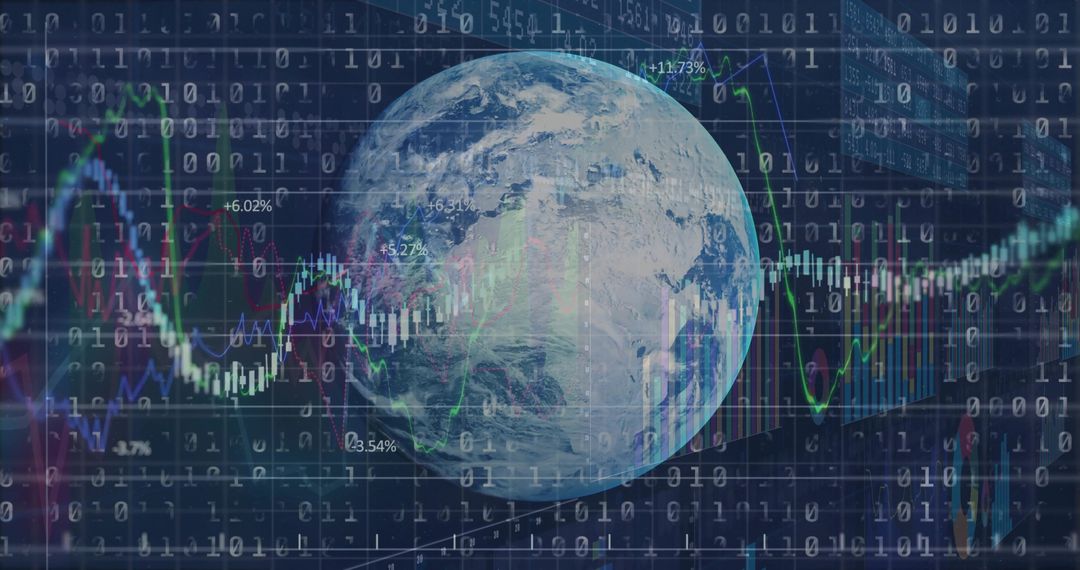
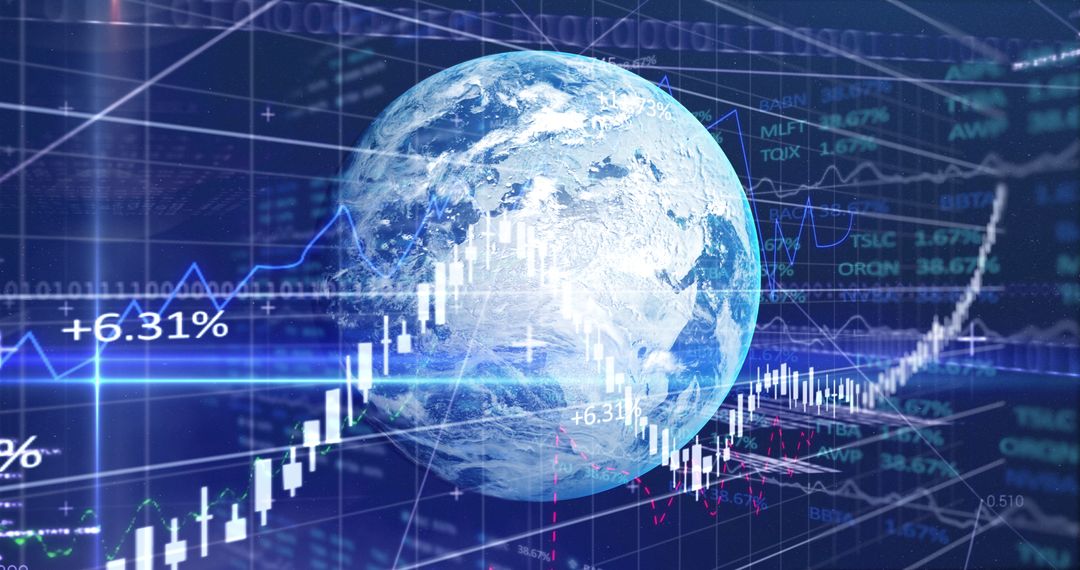
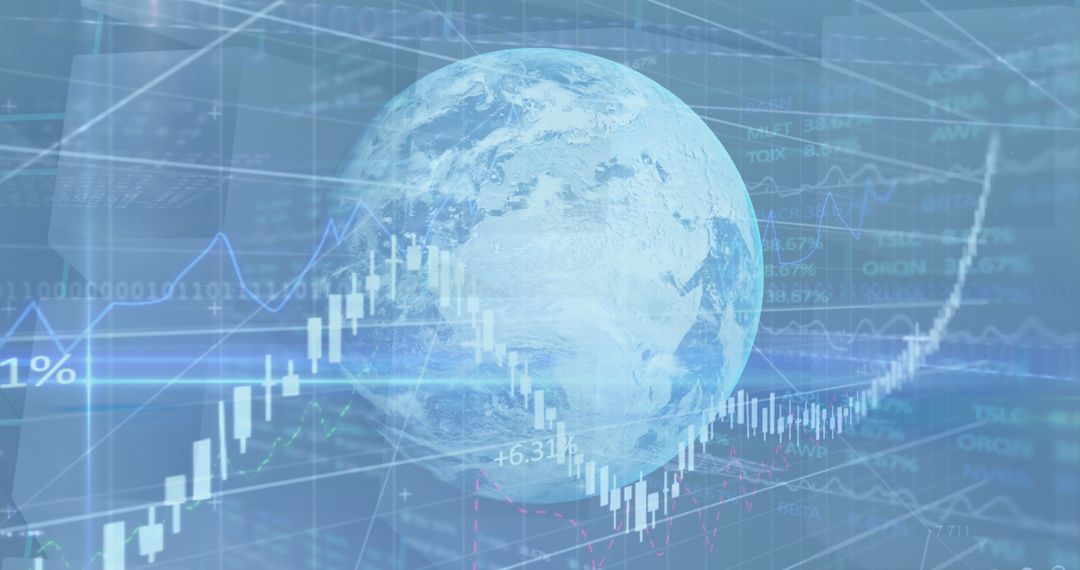
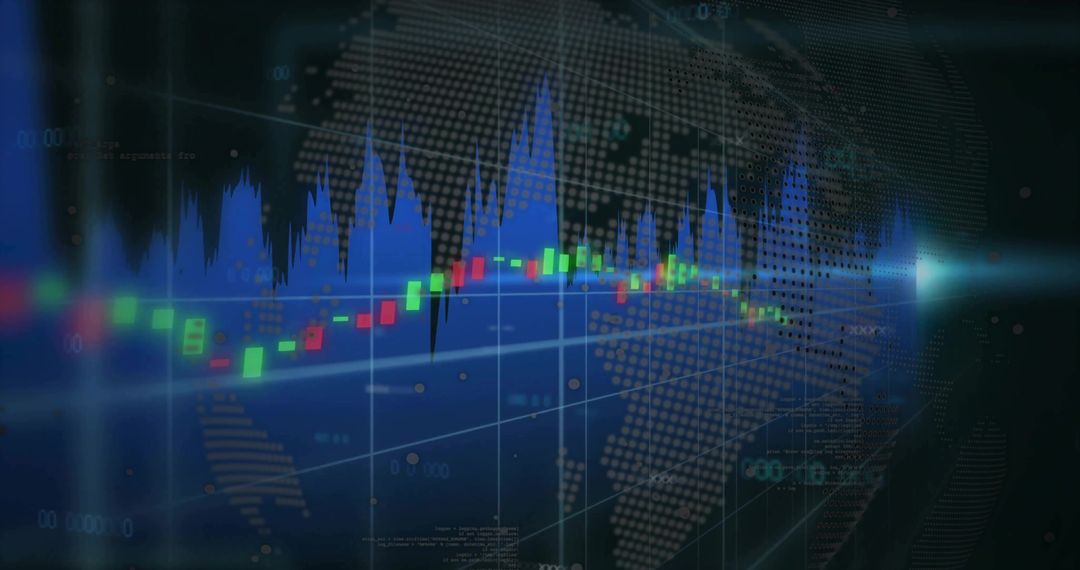
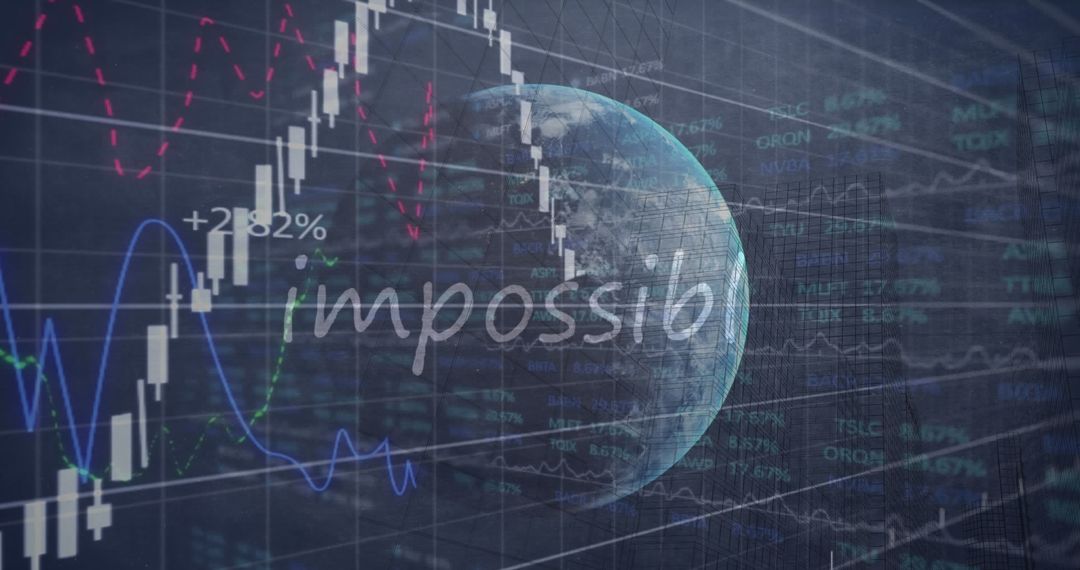
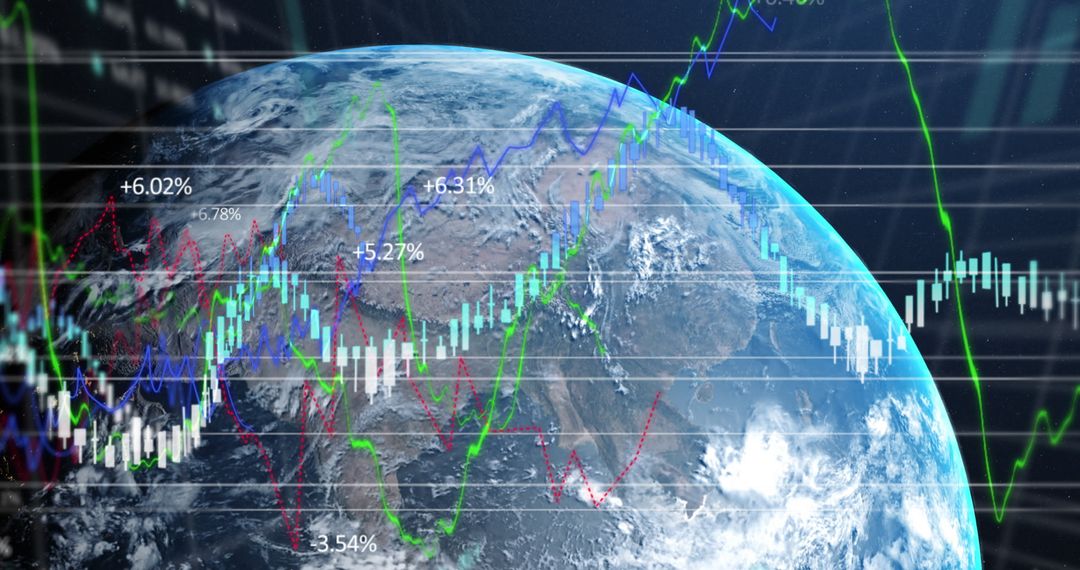
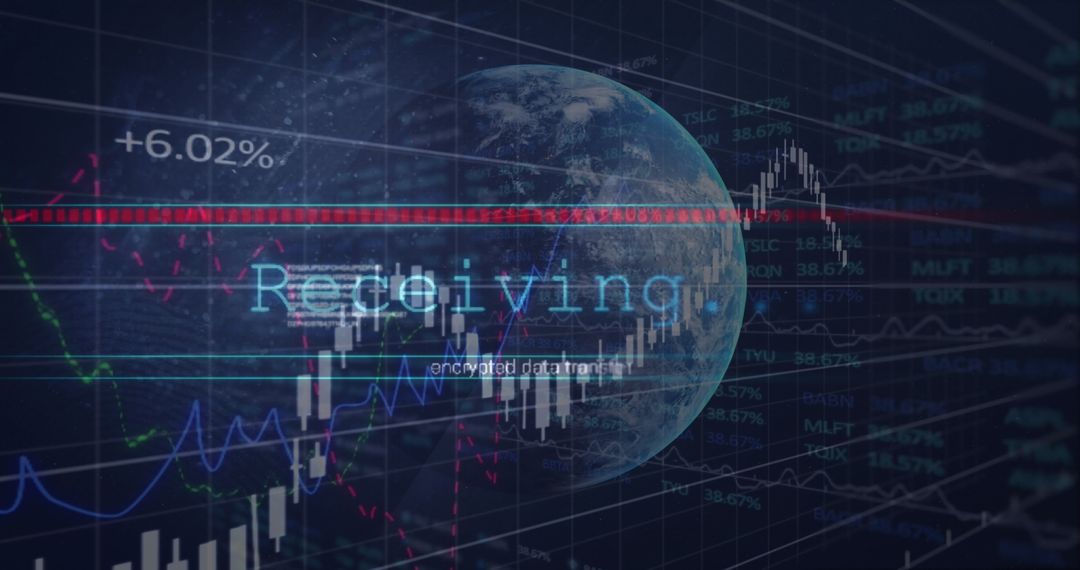
- Global Financial Markets with Digital Interconnected Data
Global Financial Markets with Digital Interconnected Data Image

Depicts dynamic connection of global financial markets with real-time digital data. Useful for articles or presentations on global economy trends, stock market insights, or fintech innovations. Features futuristic digital graphs intersecting over Earth's view highlighting connectivity in business landscapes.
Powered by 


2
downloads
downloads
Tags:
More
Credit Photo
If you would like to credit the Photo, here are some ways you can do so
Text Link
photo Link
<span class="text-link">
<span>
<a target="_blank" href=https://pikwizard.com/photo/global-financial-markets-with-digital-interconnected-data/ac16d573a84d26c53b97e384a7d7d5b4/>PikWizard</a>
</span>
</span>
<span class="image-link">
<span
style="margin: 0 0 20px 0; display: inline-block; vertical-align: middle; width: 100%;"
>
<a
target="_blank"
href="https://pikwizard.com/photo/global-financial-markets-with-digital-interconnected-data/ac16d573a84d26c53b97e384a7d7d5b4/"
style="text-decoration: none; font-size: 10px; margin: 0;"
>
<img src="https://pikwizard.com/pw/medium/ac16d573a84d26c53b97e384a7d7d5b4.jpg" style="margin: 0; width: 100%;" alt="" />
<p style="font-size: 12px; margin: 0;">PikWizard</p>
</a>
</span>
</span>
Free (free of charge)
Free for personal and commercial use.
Author: People Creations
Similar Free Stock Images
Premium


Premium


Premium


Premium


Premium


Premium


Premium


Premium


Premium


Premium


Premium


Premium


Premium


Premium


Premium


Premium


Premium


Premium


Premium


Premium


Premium


Premium


Premium


Premium