- Home >
- Stock Photos >
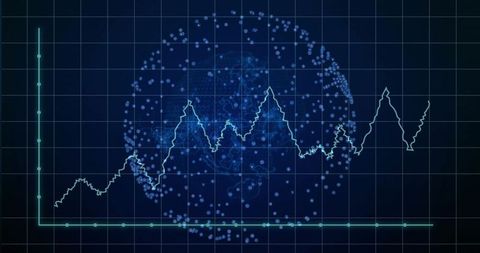
- Global Financial Network and Stock Market Analytics
Global Financial Network and Stock Market Analytics Image
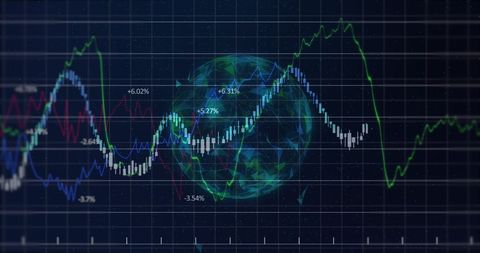
Abstract depiction of global business using digital financial data intertwining on a network globe. Various graphs and numbers illustrate stock market trends and analytics. Useful for articles, presentations on finance, global economy, and data analytics technology. Highlights the interconnectedness of global financial systems.
Powered by  - Get 15% off with code: PIKWIZARD15


2
downloads
downloads
Tags:
More
Credit Photo
If you would like to credit the Photo, here are some ways you can do so
Text Link
photo Link
<span class="text-link">
<span>
<a target="_blank" href=https://pikwizard.com/photo/global-financial-network-and-stock-market-analytics/8de7ba7e0f4ce82dec4ab94fa5dbb2b8/>PikWizard</a>
</span>
</span>
<span class="image-link">
<span
style="margin: 0 0 20px 0; display: inline-block; vertical-align: middle; width: 100%;"
>
<a
target="_blank"
href="https://pikwizard.com/photo/global-financial-network-and-stock-market-analytics/8de7ba7e0f4ce82dec4ab94fa5dbb2b8/"
style="text-decoration: none; font-size: 10px; margin: 0;"
>
<img src="https://pikwizard.com/pw/medium/8de7ba7e0f4ce82dec4ab94fa5dbb2b8.jpg" style="margin: 0; width: 100%;" alt="" />
<p style="font-size: 12px; margin: 0;">PikWizard</p>
</a>
</span>
</span>
Free (free of charge)
Free for personal and commercial use.
Author: Creative Art
Similar Free Stock Images

Premium


Premium


Premium


Premium


Premium


Premium


Premium


Premium


Premium


Premium


Premium


Premium


Premium


Premium


Premium


Premium


Premium


Premium


Premium


Premium


Premium


Premium


Premium


Premium


Premium