
- Home >
- Stock Photos >
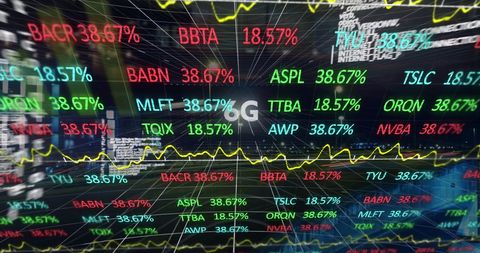
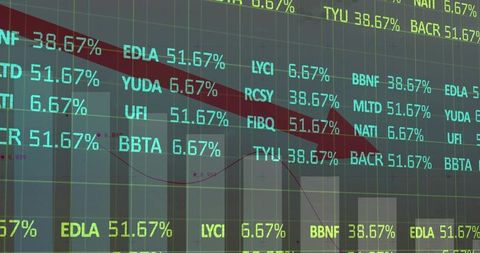
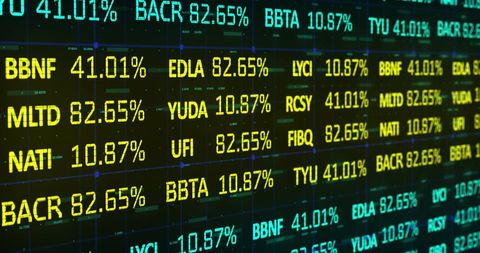
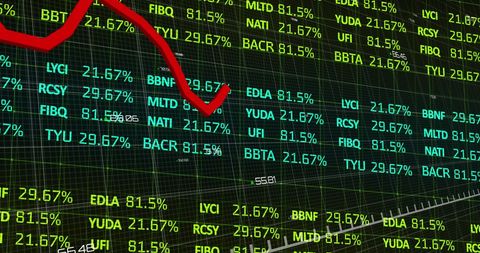
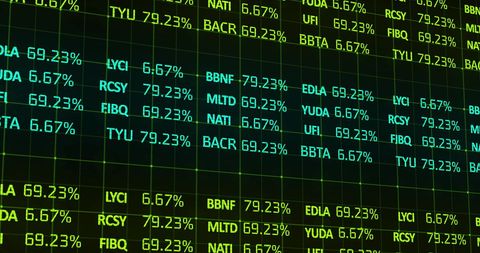
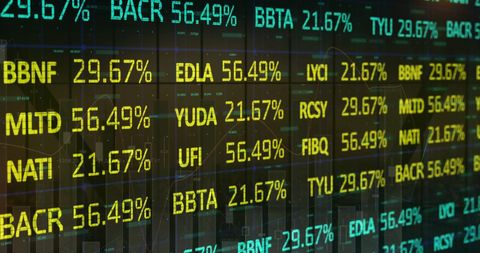
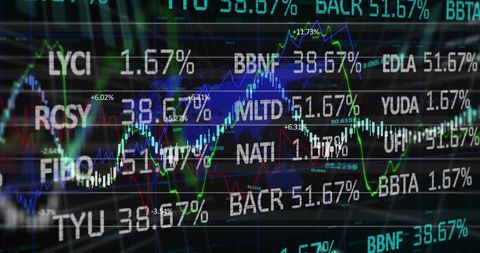
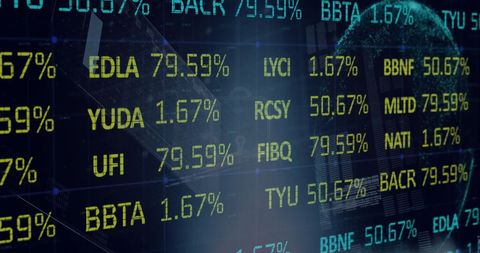
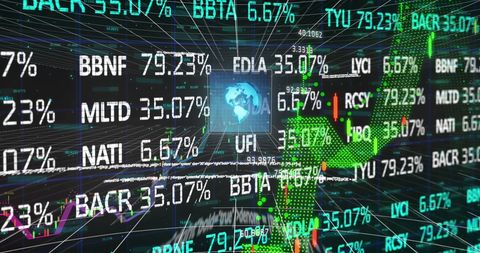
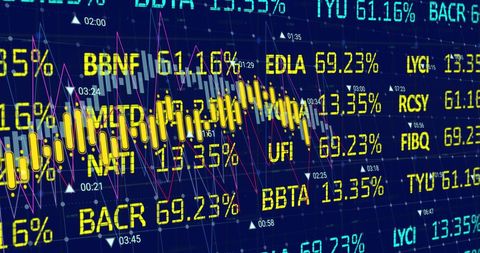
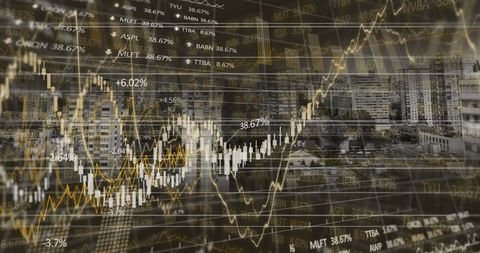
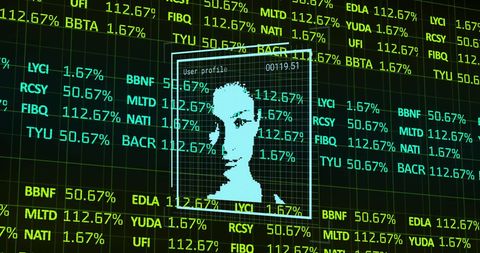
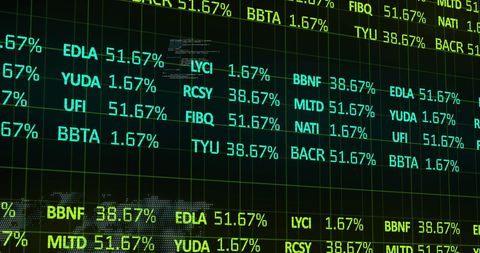
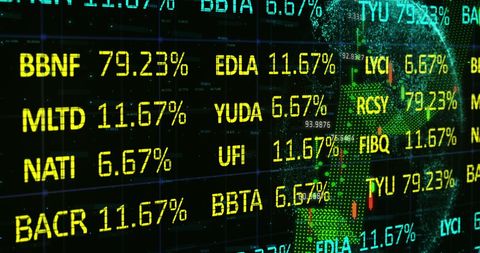
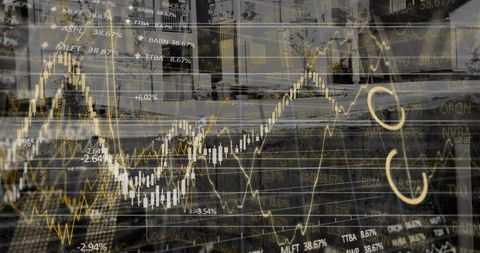
- Global Financial Operations with Dynamic Stock Data Visualizations
Global Financial Operations with Dynamic Stock Data Visualizations Image
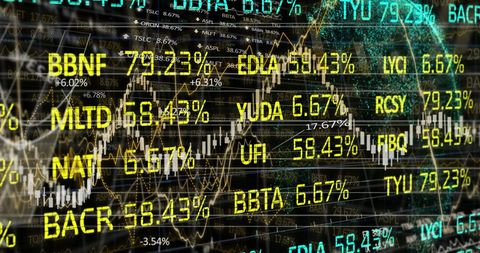
Visualization of dynamic financial data featuring stock tickers and financial charts. Ideal for content related to finance, economic analysis, or business forecasting. Useful for business presentations, financial blogs, or educational content exploring global economic trends.
Powered by 


downloads
Tags:
More
Credit Photo
If you would like to credit the Photo, here are some ways you can do so
Text Link
photo Link
<span class="text-link">
<span>
<a target="_blank" href=https://pikwizard.com/photo/global-financial-operations-with-dynamic-stock-data-visualizations/3d5a5417ee4e05a620de52eb758ecac1/>PikWizard</a>
</span>
</span>
<span class="image-link">
<span
style="margin: 0 0 20px 0; display: inline-block; vertical-align: middle; width: 100%;"
>
<a
target="_blank"
href="https://pikwizard.com/photo/global-financial-operations-with-dynamic-stock-data-visualizations/3d5a5417ee4e05a620de52eb758ecac1/"
style="text-decoration: none; font-size: 10px; margin: 0;"
>
<img src="https://pikwizard.com/pw/medium/3d5a5417ee4e05a620de52eb758ecac1.jpg" style="margin: 0; width: 100%;" alt="" />
<p style="font-size: 12px; margin: 0;">PikWizard</p>
</a>
</span>
</span>
Free (free of charge)
Free for personal and commercial use.
Author: Creative Art
Similar Free Stock Images
Premium


Premium

Premium


Premium

Premium


Premium


Premium


Premium


Premium


Premium


Premium


Premium


Premium


Premium


Premium


Premium


Premium


Premium


Premium

Premium


Premium


Premium


Premium


Premium


Premium


Explore More Free Stock Images