- Home >
- Stock Photos >
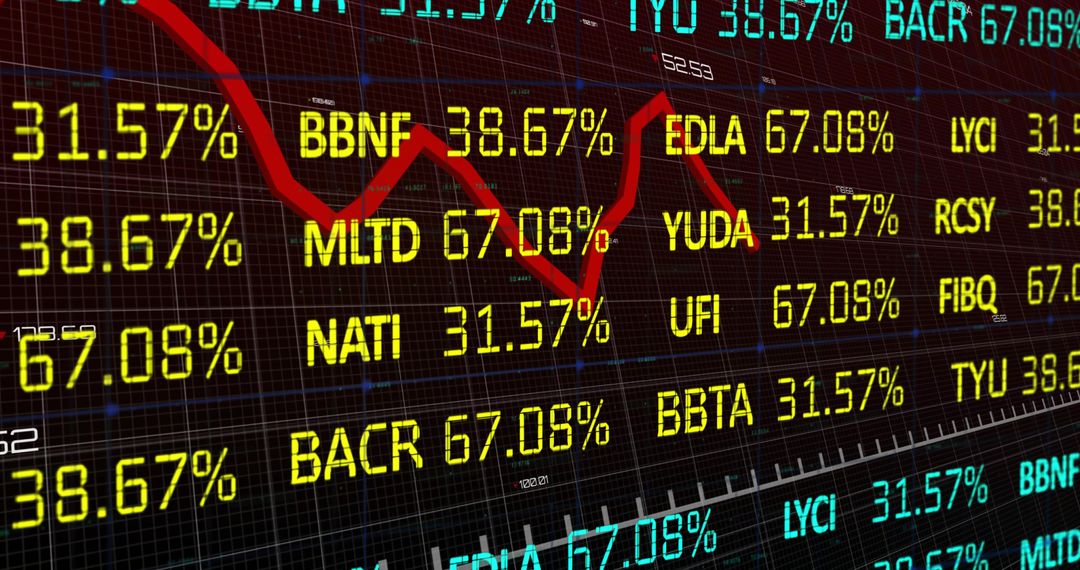
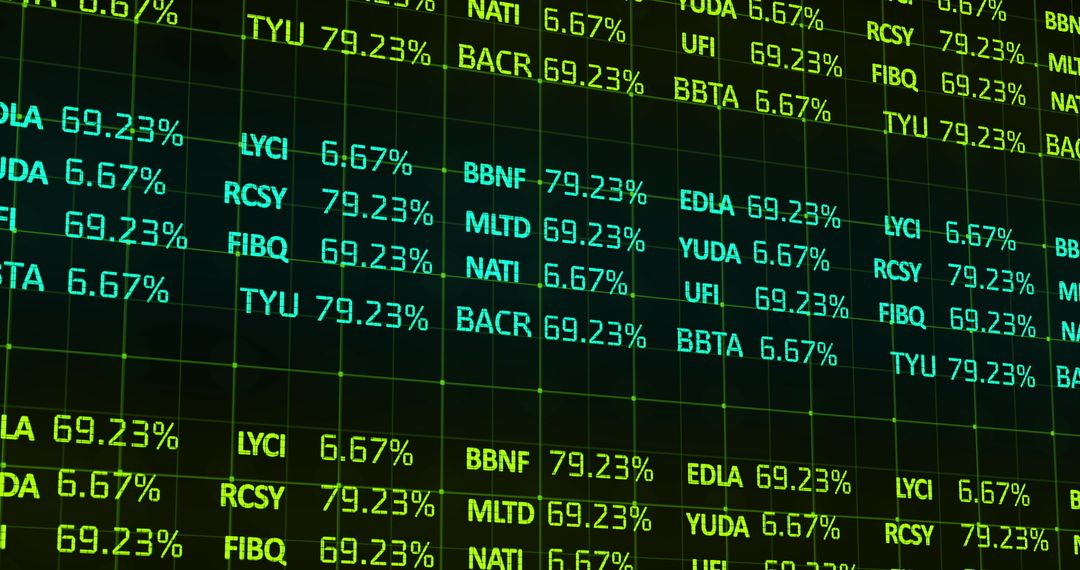
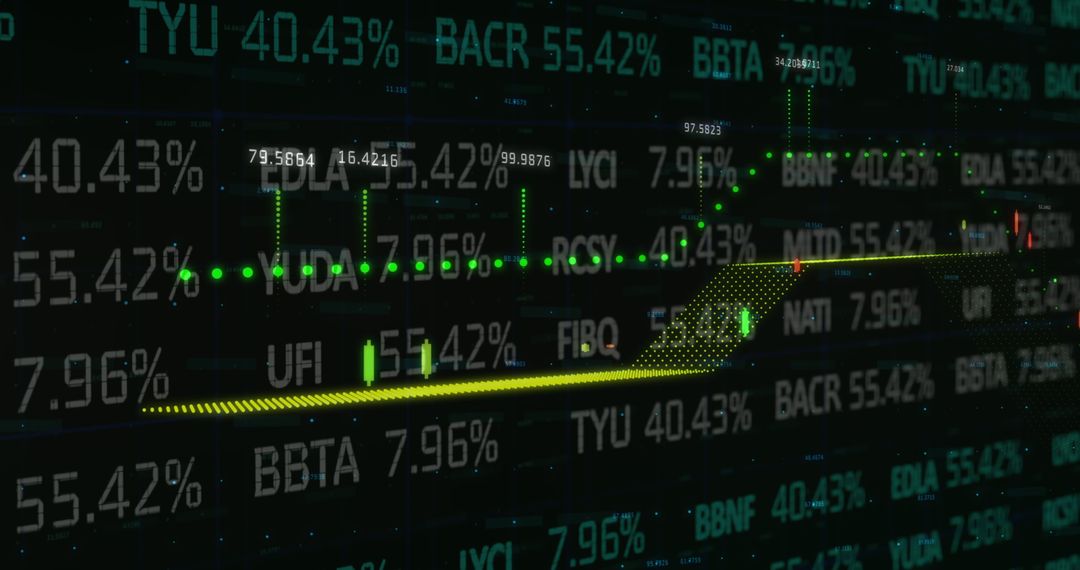
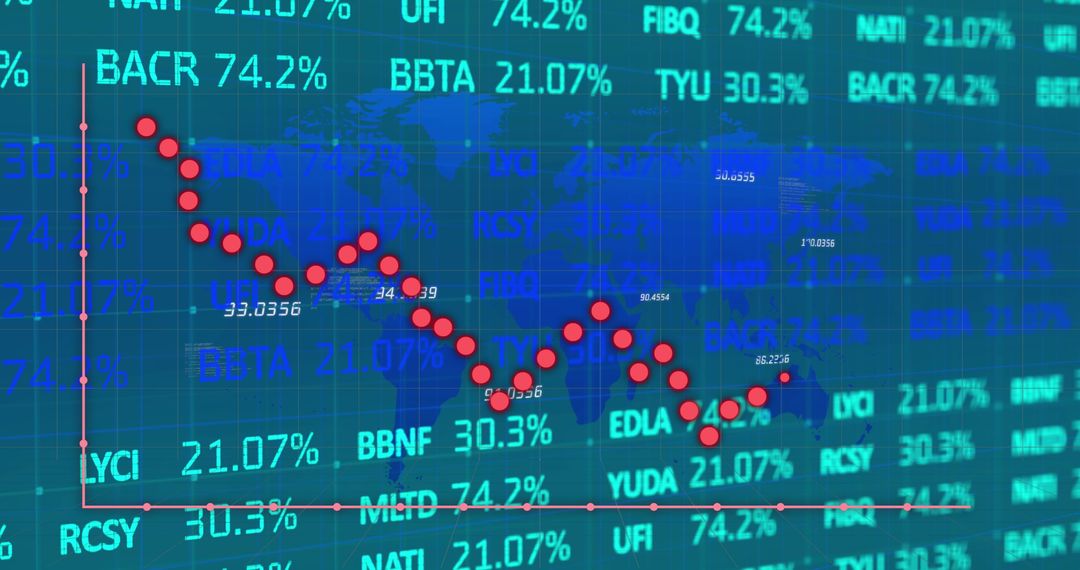
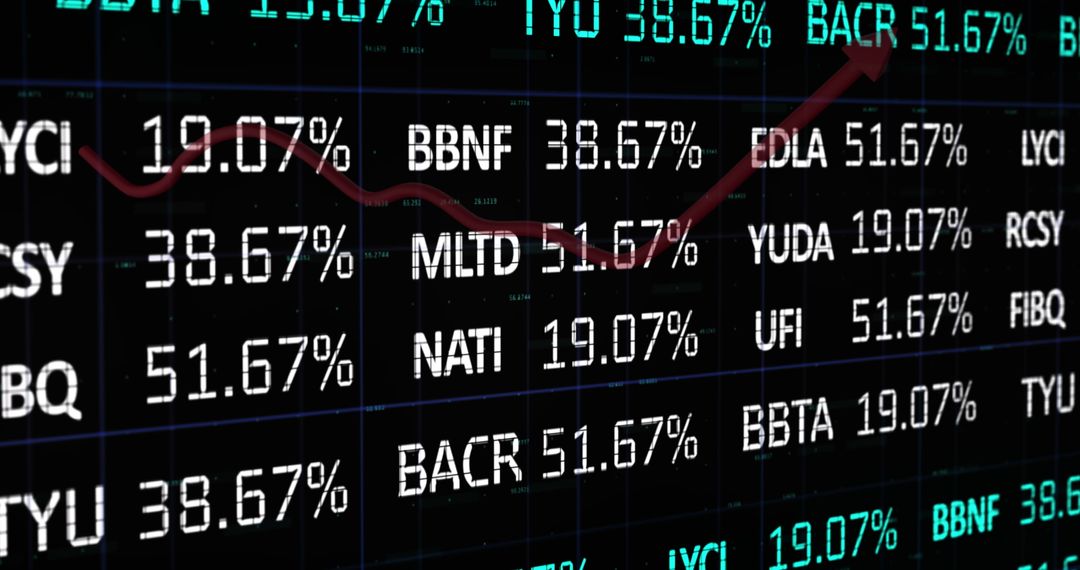
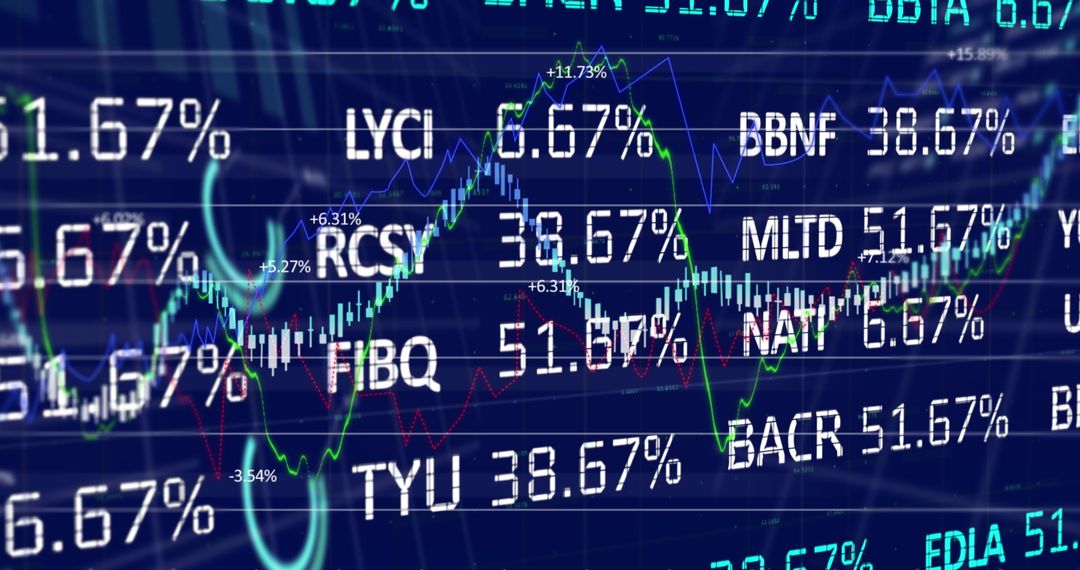
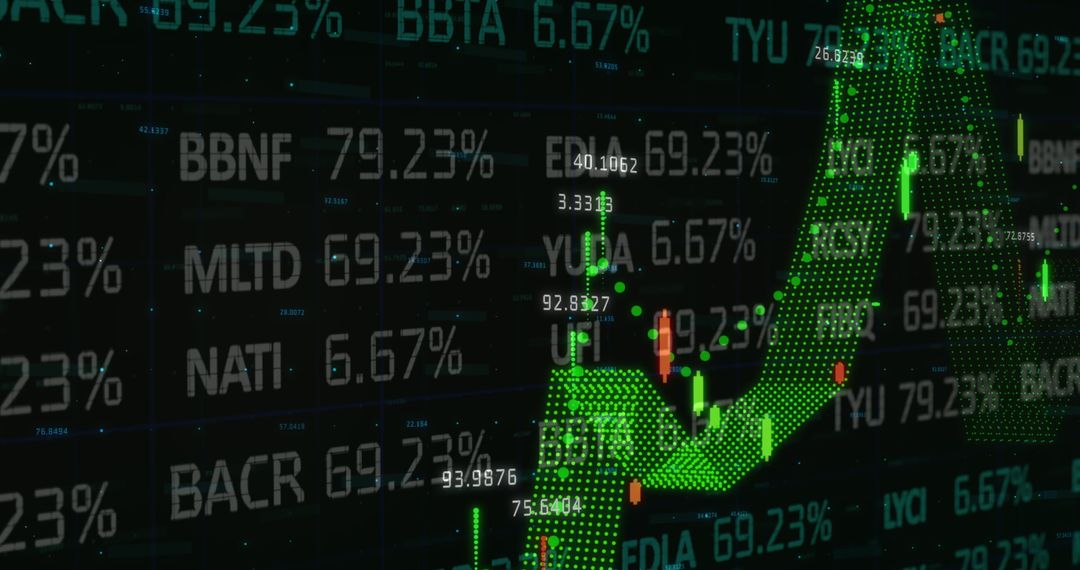
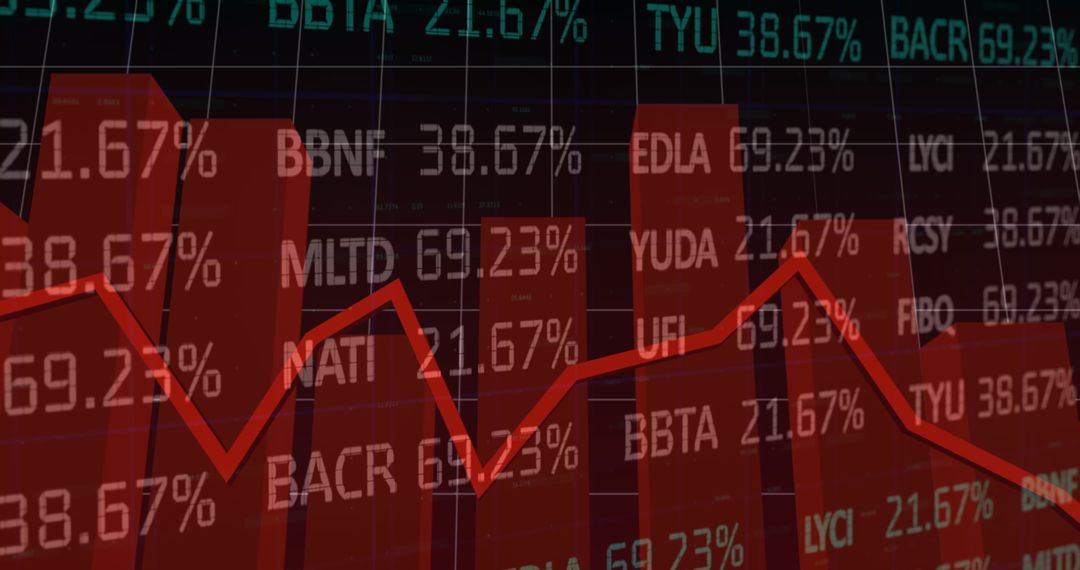
- Global Financial Stock Market Analysis and Data Visuals
Global Financial Stock Market Analysis and Data Visuals Image

Displays diverse financial data and stock market fluctuations with graphical visuals of trending stocks and performance figures. Useful for financial reports, investment presentations, and conveying economic market dynamics.
Powered by 


2
downloads
downloads
Tags:
More
Credit Photo
If you would like to credit the Photo, here are some ways you can do so
Text Link
photo Link
<span class="text-link">
<span>
<a target="_blank" href=https://pikwizard.com/photo/global-financial-stock-market-analysis-and-data-visuals/0bac9890c29e032c5c3b19a579b4d486/>PikWizard</a>
</span>
</span>
<span class="image-link">
<span
style="margin: 0 0 20px 0; display: inline-block; vertical-align: middle; width: 100%;"
>
<a
target="_blank"
href="https://pikwizard.com/photo/global-financial-stock-market-analysis-and-data-visuals/0bac9890c29e032c5c3b19a579b4d486/"
style="text-decoration: none; font-size: 10px; margin: 0;"
>
<img src="https://pikwizard.com/pw/medium/0bac9890c29e032c5c3b19a579b4d486.jpg" style="margin: 0; width: 100%;" alt="" />
<p style="font-size: 12px; margin: 0;">PikWizard</p>
</a>
</span>
</span>
Free (free of charge)
Free for personal and commercial use.
Author: Creative Art
Similar Free Stock Images
Premium


Premium


Premium


Premium


Premium


Premium


Premium


Premium


Premium


Premium


Premium


Premium


Premium


Premium


Premium


Premium


Premium


Premium


Premium


Premium


Premium


Premium


Premium


Premium