1. Home > 
  2. Stock Photos > 
  3. Global Financial Stock Market Data Analysis

Global Financial Stock Market Data Analysis Image

Global Financial Stock Market Data Analysis

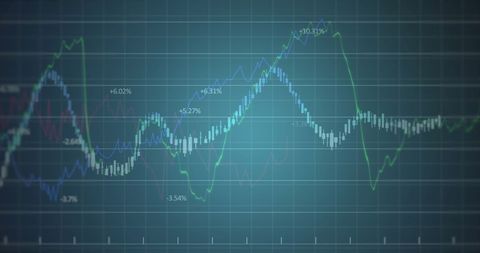
Visual representation of stock market trends through data charts and graphs. Ideal for illustrating financial reports, global business strategies, economic analysis articles, and investment research. Used effectively for materials involving financial forecasting and digital market assessments.

Powered by Shutterstock logo - Get 15% off with code: PIKWIZARD15
Man look at the dashboard with graphs and charts. Concept of data management system, business intelligence, data statistics, marketing analysis, key performance indicators (KPI) and analytics. - Powered by Shutterstock - Get 15% off with code: PIKWIZARD15Using tablet pc, Consultant between bookkeepers and accounting lawyer consultation about asset, balance sheet, stock market statistics and yearly tax law, protect business from bribery. - Powered by Shutterstock - Get 15% off with code: PIKWIZARD15Man look at the dashboard with graphs and charts. Concept of data management system, business intelligence, data statistics, marketing analysis, key performance indicators (KPI) and analytics. - Powered by Shutterstock - Get 15% off with code: PIKWIZARD15Analytical data and development statistics. Web analytics and product testing techniques are being measured. A guy studies an SEO dashboard and a digital report. - Powered by Shutterstock - Get 15% off with code: PIKWIZARD15Financial data on a monitor as Finance data concept. Analytics report status information of stock market in digital screen. which including of candle stick trend and digital number synbol. - Powered by Shutterstock - Get 15% off with code: PIKWIZARD15

Credit Photo

If you would like to credit the Photo, here are some ways you can do so

Free (free of charge)

Free for personal and commercial use.

Author: People Creations

Similar Free Stock Images

Loading...
Digital Stock Market Data with Floating Points on Black Background
Premium
Image of financial data processing over grid. Global business, finance, computing and data processing concept digitally generated image.
Neon Green Electrocardiogram Wave on Black Background
Premium
Expert woman asian people discuss review data number costing managerial account prepare monthly actual cost variance report income tax at audit office. ESG budget control ERP process service project.
Dynamic Financial Graph with Wavy Data Line over Navy Background
Financial Growth Graph on Green Digital Grid Background
Dynamic Financial Chart with Data Points on Red Grid Background
Red Graph Showing Downward Trend on Digital Grid
Digital Interface Showing Global Business Data Analytics
Data Analytics and Financial Growth Indicators
Stagflation Concept Overlaid on Palestinian Flag Background
Digital Financial Data with Graph and Grid Patterns
Futuristic Graph with Digital Globe Symbolizing Global Technology Connections
Dynamic Stagflation Concept Displaying Economic Burdens
Data Trends and Analysis on 3D Digital Grid
Abstract Digital Waveform and Data Visualization on Dark Background
Premium
Businesswomen analyze chart data business on a visual screen dashboard laptop, technology devices and screens visible in the background, financial planning, market research, and the stock market.
Premium
Image of interface with stock market data processing over spinning windmill against blue sky. Global economy and renewable energy technology concept
Futuristic Global Finance Chart with Rotating Globe Animation
Data Visualization with Rising Red Arrow and Floating Numbers
Digital Financial Data Analytics and Trend Graphs
Futuristic Financial Chart with Declining Trend
Glowing Financial Graph of Stock Market Trends on Digital Screen
Digital Graph Displaying Dynamic Data Analysis
Dynamic Financial Graphs Overlaying Modern Cityscape
Cityscape with Digital Stock Market Graphs and Statistics
Financial Data Analysis with Futuristic Technology Interface
Digital Sound Wave with Frequency Bars on Dark Blue Background
Dynamic Financial Data Chart Showing Trend Analysis
Financial Growth Stock Nikkei in Urban City Skyline
Premium
Businessman touching data analytics process system with KPI financial charts, dashboard of stock and marketing on virtual interface. With Saudi Arabia flag in background.
Digital Data Processing with Chart in Futuristic Interface
Abstract Digital Graphs Showing Financial Data Analysis
Line Graphs on Digital Background Show Financial Data Trends
Economic and Political Factors Influence Investment Trends
Financial Data Graph Rendering Global Market Trends
Rising Stock Market Graph on Blue Financial Background
Digital Financial Graph Over Violet Background in Abstract Style
Premium
3D blue bar graph rising, sotck market informations
Premium
Beautiful 3D red bar graph fall down following the arrow.
Premium
Digital tablet showing charts
Premium
Asia woman expert people AI deep tech talent working on project predict sales insight SEO graph chart plan visual big data science report center BI smart tools screen. Office worker asian analyst job.
Innovative Data Analysis with Dynamic Line Graph and Digital Elements
Financial Graph Analysis on Green Grid Background
Abstract Digital Graph and Code on Violet Background
Premium
Businesswomen analyze chart data business on a visual screen dashboard laptop, technology devices and screens visible in the background, financial planning, market research, and the stock market.
Premium
Abstract virtual financial graph hologram on USA flag and sunset sky background, forex and investment concept. Multiexposure
Digital Financial Data Graph Showcasing Market Trends
Data Analytics Graphs on Digital Interface Background
Digital Finance Chart Overlaying Globe Background
Colorful Data Visualization on Dark Background
Premium
strategy analysis concept, Businessman working  financial Manager Researching Process accounting calculate analyse market graph data stock information review on the table in office
Dynamic Green Line Graph Depicting Financial Data
Financial Data Graphics Over World Map in Digital Style
Dynamic Financial Chart with Upward Growth Arrow
Financial Data Processing with Green Digital Graph in Action
Premium
Data monetization concept with funnel and businessman
Dynamic Financial Data on Digital Screen
Abstract Representation of Financial Data Processing
Financial Stock Market Data Visualization with Declining Trends
Digital Stock Market Graph Red Trendline on Green Background
Futuristic Digital Representation of DNA Strand
Premium
Businessman touching data analytics process system with KPI financial charts, dashboard of stock and marketing on virtual interface. With Israel flag in background.
Abstract Financial Graph with Glowing Node on Grid Background
Graph Lines Portraying Financial Data Trends
Premium
Rising glow arrows on white stairway as business chart steps on grid, blue background. Business economic and marketing growth graph process, higher goal, success, profit, financial investment concept.
Futuristic Digital Data Analytics Interface Display
Premium
Using tablet pc, Consultant between bookkeepers and accounting lawyer consultation about asset, balance sheet, stock market statistics and yearly tax law, protect business from bribery.
Digital Financial Graph on Green Background Showing Rising Trends
Dynamic Financial Graph in Virtual Red Grid Background
Falling Line Graph on Navy Background Illustrating Economic Decline
Digital Interface with Global Financial Graphs Background
Slumpflation Concept on Armenian Flag Background
Stagflation with Polish Economic Data Visualization
Abstract Financial Graph with Rising Waves on Red Gradient
Premium
business people analyze virtual graphic financial graph chart diagram on mobile laptop computer, digital technology, business strategy, stock market investment, business finance technology concept
Stock Market Data Surging Upward on Digital Display
Digital Network Connections and Data Processing Illustrative Graphic
European Market Data Overlay with EU Flag and Financial Graphs
Analyzing Stock Market Trends with Dynamic Graphs and Data
Dynamic Financial Data Visualizations on Grid Interface
Premium
Image of financial data processing over stadium. Global sport, finances and digital interface concept digitally generated image.
Abstract Digital Charts with Social Media Metrics Rising
Digital Data Prozessing with Global Interface Design
Global Networking Concept with 6G Technology Display
Premium
Analytics Report Status Information Analysis Chart Graph Concept
Premium
Image of security padlock icon, financial and stock market data processing against tall building. Global economy and cyber security technology concept
Dynamic Financial Graphs Overlaying Urban Skyline
Digital Data Visualization with Green Graph and Scanning Beams
Global Data Analytics Over World Map with Numeric Statistics
Premium
Image of blue lines financial data processing, city over flag of south korea. Global business, finance, data processing and digital interface concept digitally generated image.
Dynamic Stock Market Chart with Fluctuating Trends and Data Points
Dynamic Data Analysis on Digital Graph, Technology Background
Futuristic Digital Graph Showing Data Trends on Analytic Interface
Glowing Data Lines on Financial Graph Grid Background
Digital Financial Data Overlaying City Skyline at Dusk
Digital Cardiograph on Black Background in Colorful Display
Futuristic Data Analytics Over Technical Blueprint Design
Rising Financial Graph on Dark Grid Background
Digital Graph Display with Dynamic Flux on Purple Background
Dynamic Financial Graph on Luminous Green Background
Dynamic Financial Graph on Purple Background
Rising Digital Graph and Data Visualizations on Black Background
Digital Financial Data on Server with Stock Market Graph
Global Economy Displaying Growth Trends with Ukraine-NATO Financial Outlook
Premium
Using tablet pc, Consultant between bookkeepers and accounting lawyer consultation about asset, balance sheet, stock market statistics and yearly tax law, protect business from bribery.
Dynamic Graphs Overlay on Data Center Servers Illustrating Technology Impact
Stagflation Concept with Digital Financial Graphs
Digital DNA Strand Overlaid with Scientific Data Patterns
Financial Graph Displayed Over City Skyline at Sunset
Futuristic Financial Graph with Data Overlays in Blue Holographic Style
Abstract Digital Finance Chart Showing Fluctuating Graph Lines
Digital Data Visualization with Trend Lines and Percentage Changes
Rising Financial Data Graph on Digital Grid Background
City Skyline with Overlay of Financial Market Trends
Premium
Forex market charts on computer display. Business analysis diagram. Candle stick graph chart. Share price candlestick chart. Fundamental and technical analysis concept. Price chart bars.
NFT Financial Data Visualization with Digital Graph Overlay
Financial Data Analysis and Digital Interface Concept
Interactive Social Media Metrics Overlaid on Business Data Graph
Line Graph Illustrating Data Trend on Green Digital Background
Premium
Digital Infrastructure and Business Enterprise
Digital Data Processing with Graph and Grid Technology Interface
Digital Graphs and Data Visualization on Green Background
Abstract Green Waves in Digital Motion Fantasy Scape
Premium
Businessman  standing and operate tablet to control and connect big data of real estate sector stock market index with chart and graph background.