- Home >
- Stock Photos >
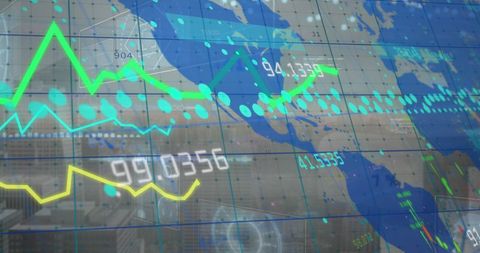
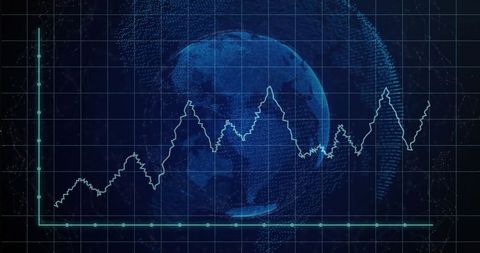
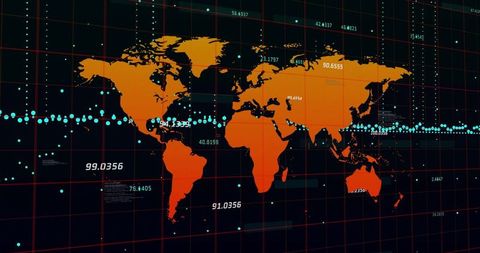
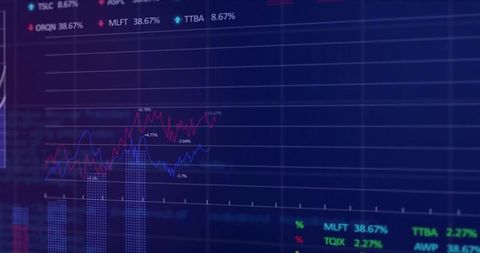
- Global Financial Trading with Data Analytics Display
Global Financial Trading with Data Analytics Display Image

This dynamic display focuses on global finance and trading with a world map layered over intricate candlestick bars and analytic line graphs. Ideal for illustrating concepts in market analysis, investment strategies, and economic data assessment. Useful in finance-related reports, technology articles featuring trading software, or investment app visuals.

downloads
Tags:
More
Credit Photo
If you would like to credit the Photo, here are some ways you can do so
Text Link
photo Link
<span class="text-link">
<span>
<a target="_blank" href=https://pikwizard.com/photo/global-financial-trading-with-data-analytics-display/b33e5e4409da5a92aadf0be192a47574/>PikWizard</a>
</span>
</span>
<span class="image-link">
<span
style="margin: 0 0 20px 0; display: inline-block; vertical-align: middle; width: 100%;"
>
<a
target="_blank"
href="https://pikwizard.com/photo/global-financial-trading-with-data-analytics-display/b33e5e4409da5a92aadf0be192a47574/"
style="text-decoration: none; font-size: 10px; margin: 0;"
>
<img src="https://pikwizard.com/pw/medium/b33e5e4409da5a92aadf0be192a47574.jpg" style="margin: 0; width: 100%;" alt="" />
<p style="font-size: 12px; margin: 0;">PikWizard</p>
</a>
</span>
</span>
Free (free of charge)
Free for personal and commercial use.
Author: Creative Art