
- Home >
- Stock Photos >
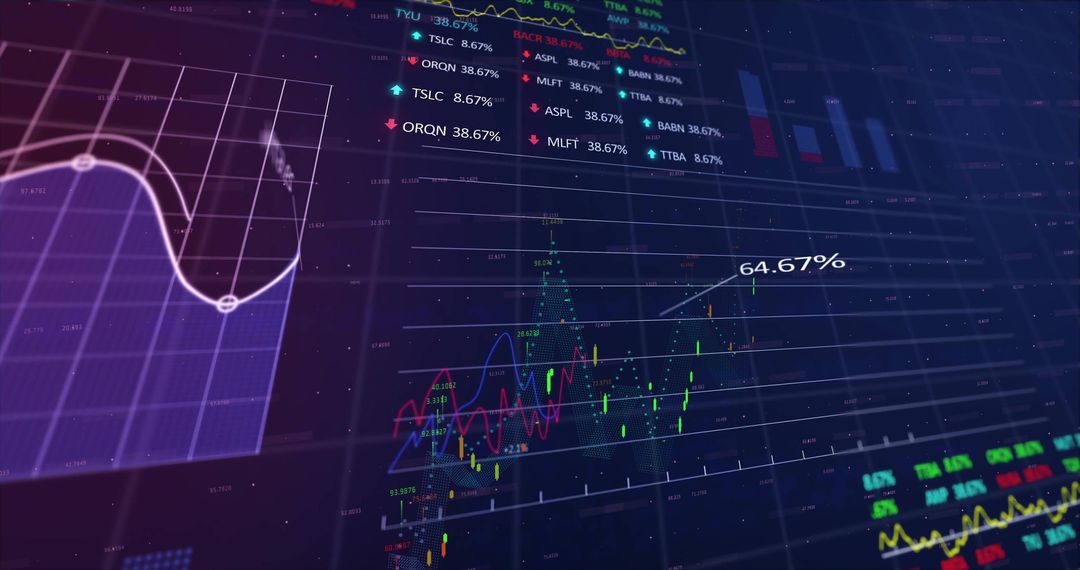
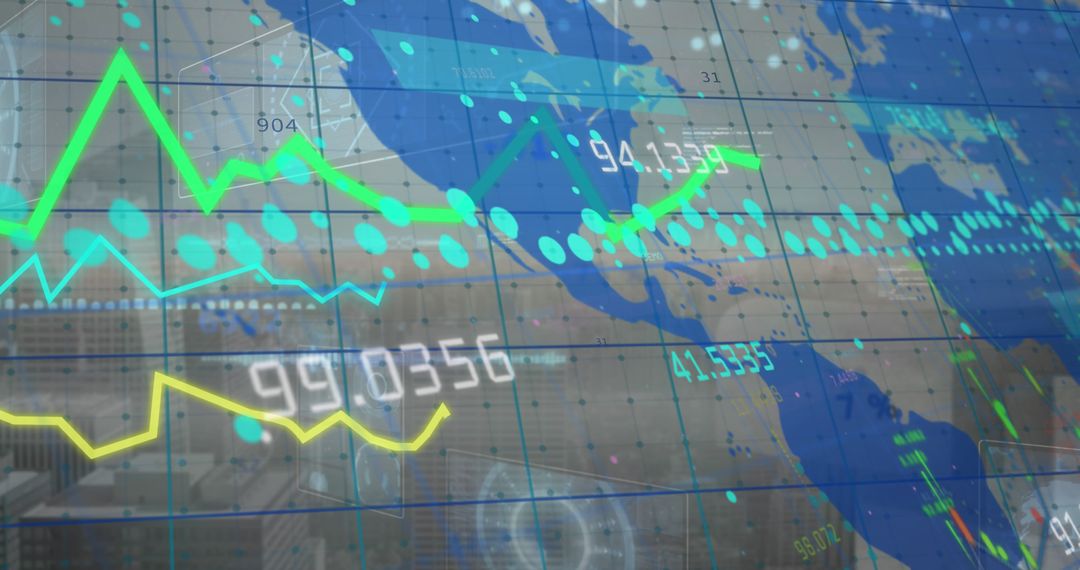
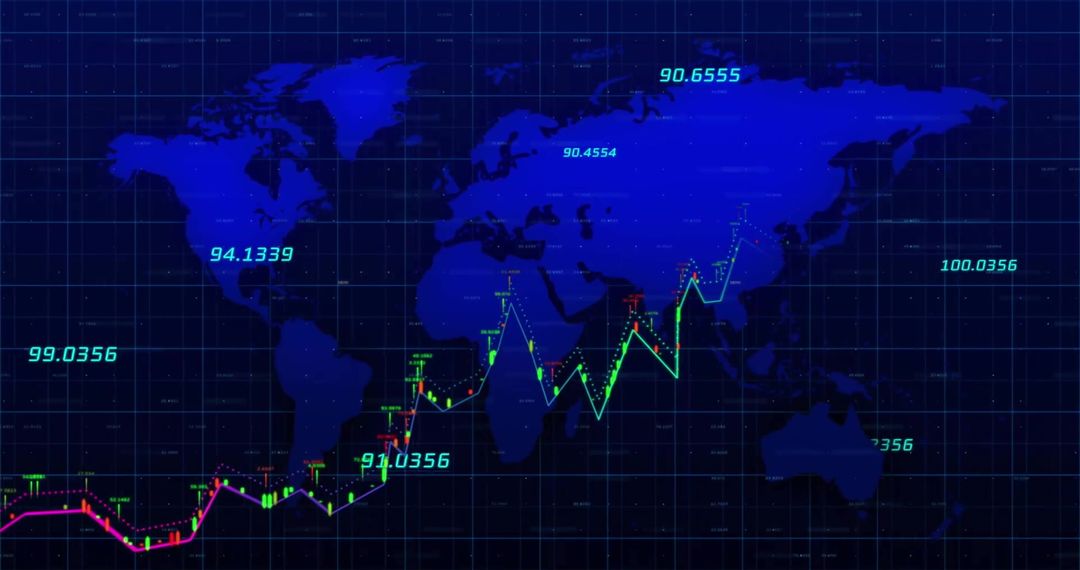
- Global Market Analysis Candlestick Chart with Data Overlay
Global Market Analysis Candlestick Chart with Data Overlay Image

This dynamic visual showcases a candlestick chart superimposed over a world map, representing global financial market trends and economic data analytics. Perfect for conveying concepts of international trading, investment strategies, or analyzing economic growth. Ideal for financial presentations, articles on market analysis, or technology and trade platform designs, providing an engaging and insightful depiction of market dynamics.
Powered by 


2
downloads
downloads
Tags:
More
Credit Photo
If you would like to credit the Photo, here are some ways you can do so
Text Link
photo Link
<span class="text-link">
<span>
<a target="_blank" href=https://pikwizard.com/photo/global-market-analysis-candlestick-chart-with-data-overlay/c78b0f9701e5330eab4f0a834c64177b/>PikWizard</a>
</span>
</span>
<span class="image-link">
<span
style="margin: 0 0 20px 0; display: inline-block; vertical-align: middle; width: 100%;"
>
<a
target="_blank"
href="https://pikwizard.com/photo/global-market-analysis-candlestick-chart-with-data-overlay/c78b0f9701e5330eab4f0a834c64177b/"
style="text-decoration: none; font-size: 10px; margin: 0;"
>
<img src="https://pikwizard.com/pw/medium/c78b0f9701e5330eab4f0a834c64177b.jpg" style="margin: 0; width: 100%;" alt="" />
<p style="font-size: 12px; margin: 0;">PikWizard</p>
</a>
</span>
</span>
Free (free of charge)
Free for personal and commercial use.
Author: Awesome Content
Similar Free Stock Images

Premium


Premium


Premium


Premium


Premium


Premium


Premium


Premium


Premium


Premium


Premium


Premium


Premium


Premium


Premium


Premium


Premium


Premium


Premium


Premium


Premium


Premium


Premium


Premium

