
- Home >
- Stock Photos >
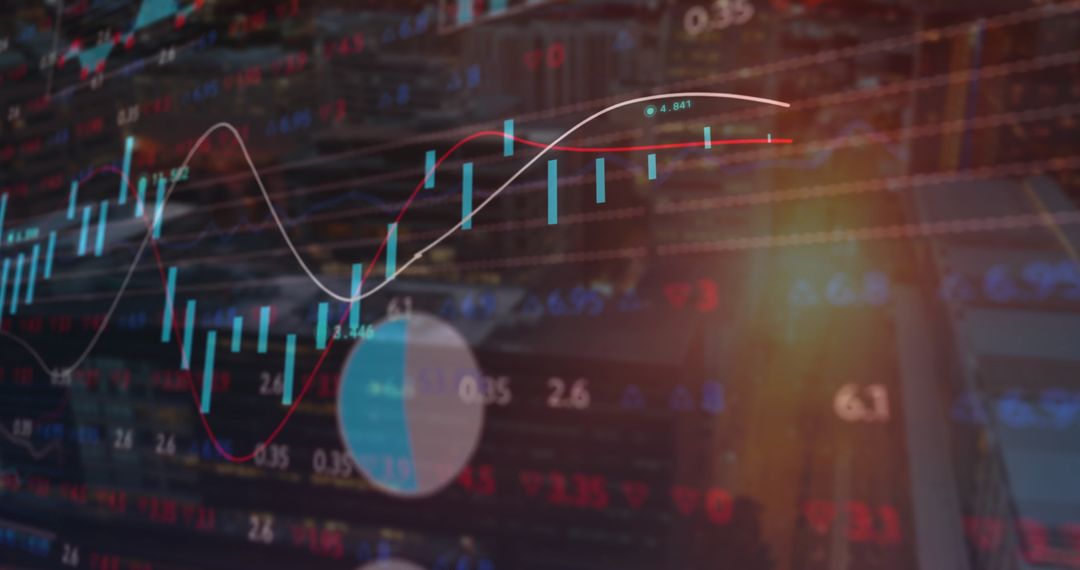
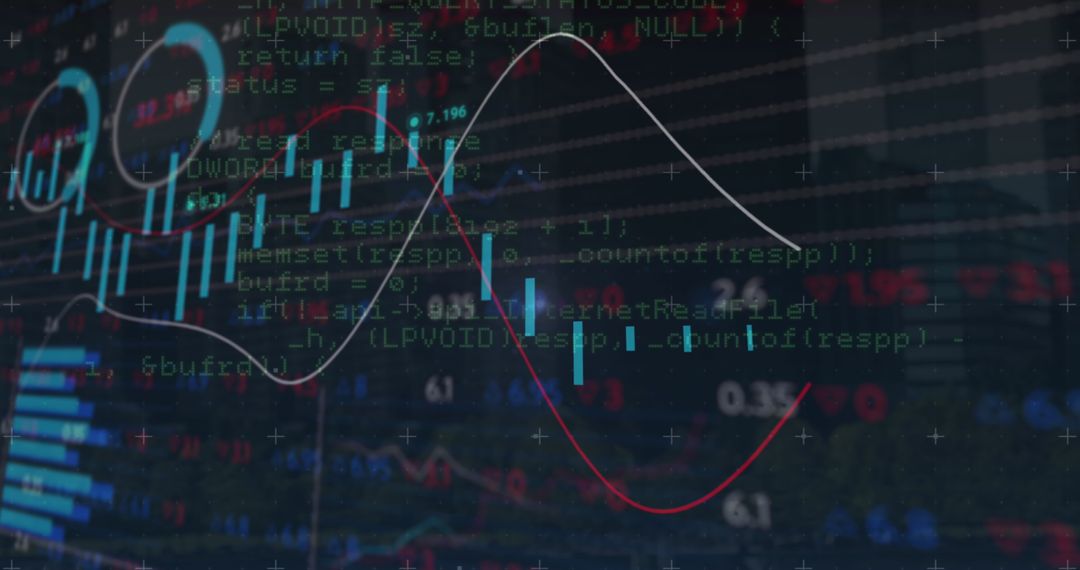
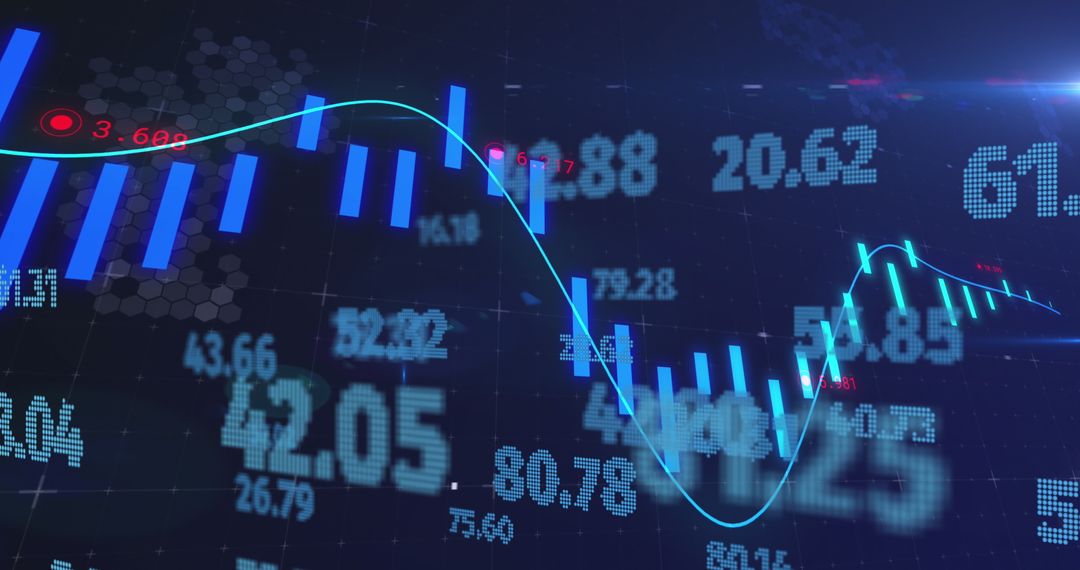
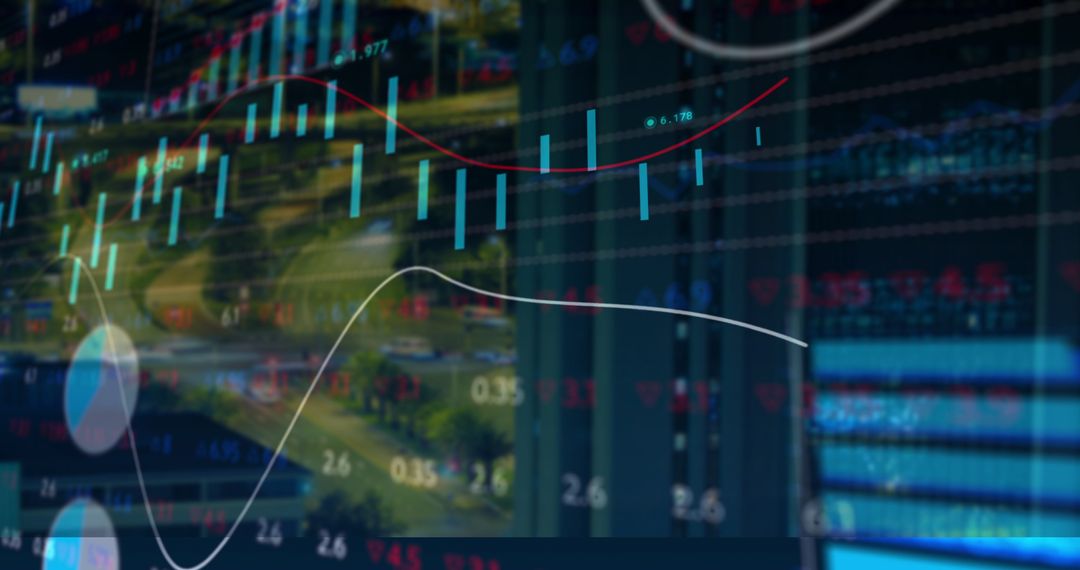
- Global Market Analytics Dashboard Showing Candlestick Charts, Line Graphs, Moving Averages
Global Market Analytics Dashboard Showing Candlestick Charts, Line Graphs, Moving Averages Image

Displaying dark navy dashboard with cyan candlesticks, red and white moving average lines over dotted world map. Conveying global market activity, technical analysis, and cross-market comparisons. Suiting fintech websites, trading platform headers, investor presentations, and financial reports. Serving as hero background for finance blogs, social media posts, and corporate slides. Supporting pitch decks for fintech startups, marketing materials for brokers, and educational content on trading strategies. Offering strong contrast and negative space for overlaying text, charts, or interface elements.
Powered by 


0
downloads
downloads
Tags:
More
Credit Photo
If you would like to credit the Photo, here are some ways you can do so
Text Link
photo Link
<span class="text-link">
<span>
<a target="_blank" href=https://pikwizard.com/photo/global-market-analytics-dashboard-showing-candlestick-charts-line-graphs-moving-averages/4856e09382f525ddbb568783ef95fb0a/>PikWizard</a>
</span>
</span>
<span class="image-link">
<span
style="margin: 0 0 20px 0; display: inline-block; vertical-align: middle; width: 100%;"
>
<a
target="_blank"
href="https://pikwizard.com/photo/global-market-analytics-dashboard-showing-candlestick-charts-line-graphs-moving-averages/4856e09382f525ddbb568783ef95fb0a/"
style="text-decoration: none; font-size: 10px; margin: 0;"
>
<img src="https://pikwizard.com/pw/medium/4856e09382f525ddbb568783ef95fb0a.jpg" style="margin: 0; width: 100%;" alt="" />
<p style="font-size: 12px; margin: 0;">PikWizard</p>
</a>
</span>
</span>
Free (free of charge)
Free for personal and commercial use.
Author: Awesome Content
Similar Free Stock Images

Premium


Premium


Premium


Premium


Premium


Premium


Premium


Premium


Premium


Premium


Premium


Premium


Premium


Premium


Premium


Premium


Premium


Premium


Premium


Premium


Premium


Premium


Premium


Premium

