- Home >
- Stock Photos >
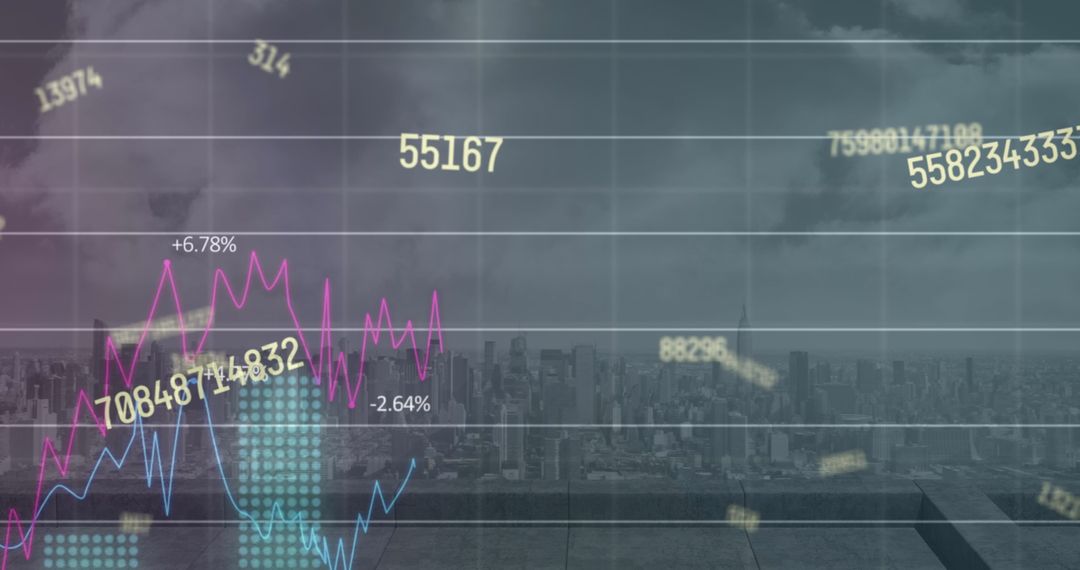
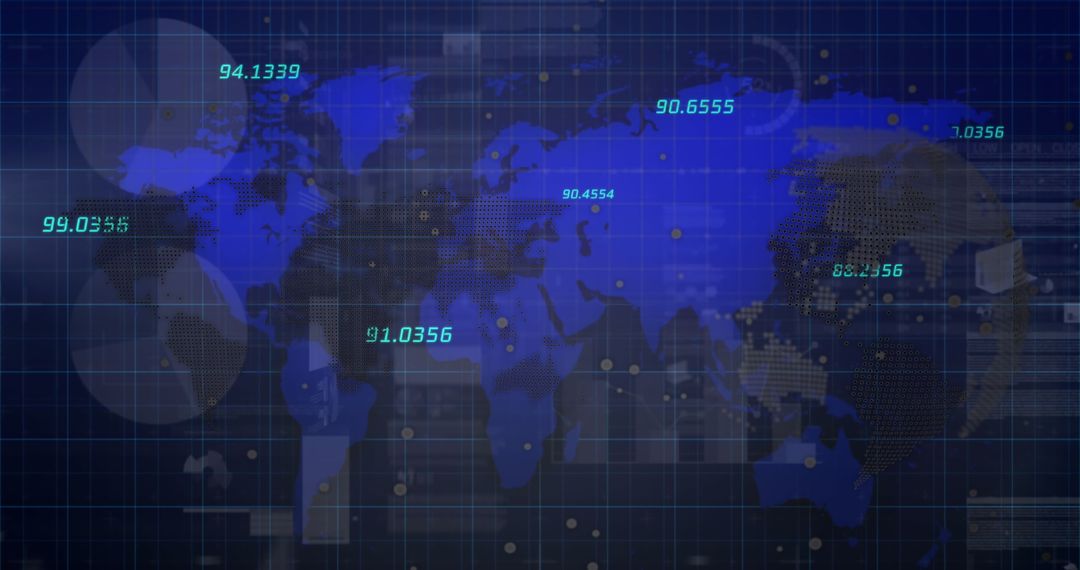
- Global Market Dashboard Displaying Rising Blue Trendline and Red Dip on Digital World Map
Global Market Dashboard Displaying Rising Blue Trendline and Red Dip on Digital World Map Image

Displaying layered financial charts over dotted world map with blue rising trendline, red dip line, cyan volume bars and horizontal gridlines. Combining neon tones and dot-map texture for modern fintech aesthetic. Serving use in website headers, financial reports, investor presentations, fintech branding, market analysis blog posts and social media campaigns. Suggesting usage techniques: crop for banner or hero layouts, add bold headline and CTA on left side, apply subtle blur to background for improved text legibility, color-match trendline to brand palette, overlay data callouts for emphasis. Providing alt text suggestion: Global financial dashboard displaying rising blue trendline, red dip and cyan volume bars over dotted world map.
Powered by  - Get 15% off with code: PIKWIZARD15


0
downloads
downloads
Tags:
More
Credit Photo
If you would like to credit the Photo, here are some ways you can do so
Text Link
photo Link
<span class="text-link">
<span>
<a target="_blank" href=https://pikwizard.com/photo/global-market-dashboard-displaying-rising-blue-trendline-and-red-dip-on-digital-world-map/d83577bcc9bf509a49f0e09a8b757b4b/>PikWizard</a>
</span>
</span>
<span class="image-link">
<span
style="margin: 0 0 20px 0; display: inline-block; vertical-align: middle; width: 100%;"
>
<a
target="_blank"
href="https://pikwizard.com/photo/global-market-dashboard-displaying-rising-blue-trendline-and-red-dip-on-digital-world-map/d83577bcc9bf509a49f0e09a8b757b4b/"
style="text-decoration: none; font-size: 10px; margin: 0;"
>
<img src="https://pikwizard.com/pw/medium/d83577bcc9bf509a49f0e09a8b757b4b.jpg" style="margin: 0; width: 100%;" alt="" />
<p style="font-size: 12px; margin: 0;">PikWizard</p>
</a>
</span>
</span>
Free (free of charge)
Free for personal and commercial use.
Author: Awesome Content
Similar Free Stock Images

Premium


Premium


Premium


Premium


Premium


Premium


Premium


Premium


Premium


Premium


Premium


Premium


Premium


Premium


Premium


Premium


Premium


Premium


Premium


Premium


Premium


Premium


Premium


Premium