- Home >
- Stock Photos >
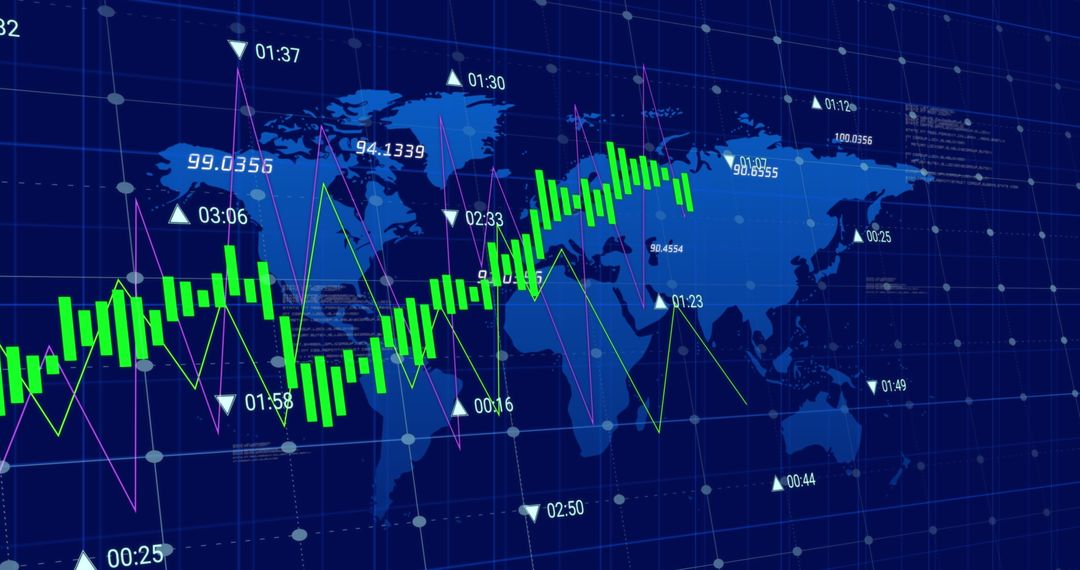
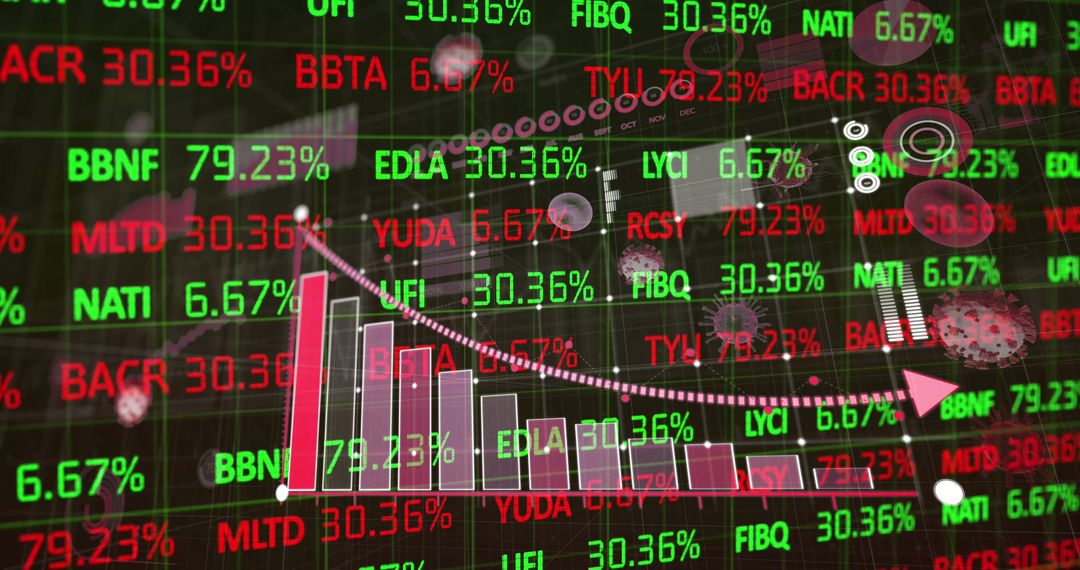
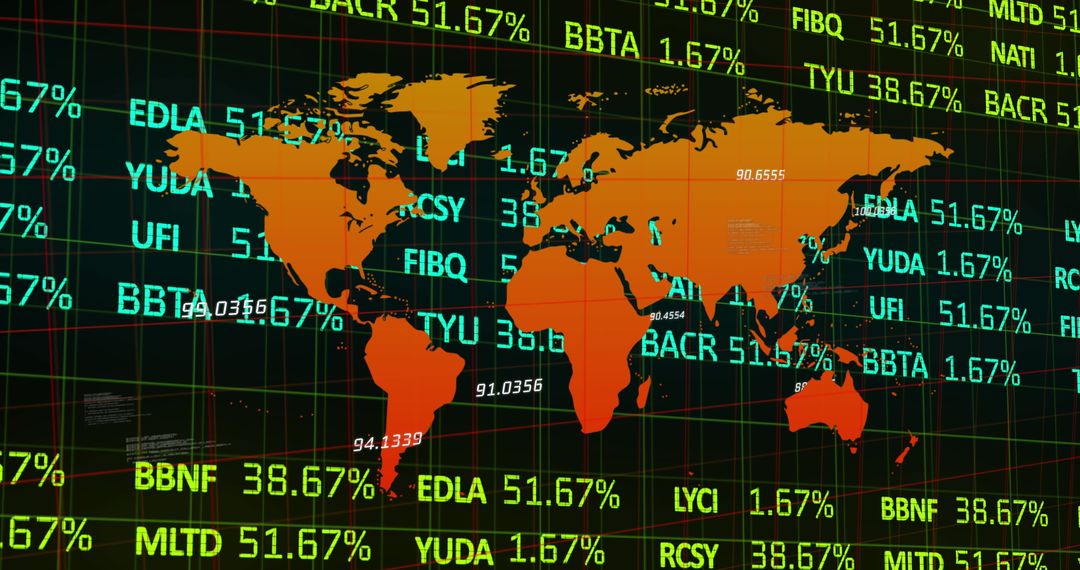
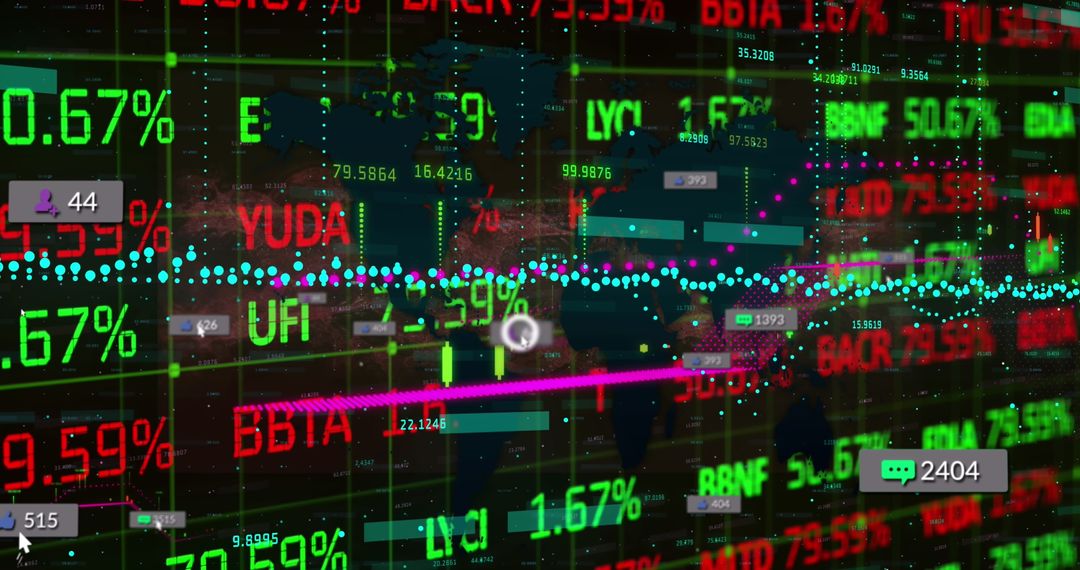
- Global Market Data Dashboard Displaying Candlestick Charts, Tickers, Energy and Car Icons
Global Market Data Dashboard Displaying Candlestick Charts, Tickers, Energy and Car Icons Image

Displaying faint red world map layered with green and red stock tickers and percentage figures, bright cyan candlestick chart and jagged line graphs forming dynamic trading visualization. Energy bolt icon and car silhouette icon suggesting energy and automotive market themes, useful for stories about electric vehicles and sector performance. Dark high-contrast palette creating urgent, high-tech mood and emphasizing market volatility and data intensity. Serving well for fintech websites, trading platform dashboards, investor presentations, market analysis reports, editorial headers, social media posts, and conference visuals. Suggesting cropping for hero banner use, leaving left or right negative space for headline text and call-to-action buttons. Recommending color overlay adjustments for brand integration and high-resolution export for print or web.
Powered by 


0
downloads
downloads
Tags:
More
Credit Photo
If you would like to credit the Photo, here are some ways you can do so
Text Link
photo Link
<span class="text-link">
<span>
<a target="_blank" href=https://pikwizard.com/photo/global-market-data-dashboard-displaying-candlestick-charts-tickers-energy-and-car-icons/d6a3e64be73e9a9bf5123c43e664f531/>PikWizard</a>
</span>
</span>
<span class="image-link">
<span
style="margin: 0 0 20px 0; display: inline-block; vertical-align: middle; width: 100%;"
>
<a
target="_blank"
href="https://pikwizard.com/photo/global-market-data-dashboard-displaying-candlestick-charts-tickers-energy-and-car-icons/d6a3e64be73e9a9bf5123c43e664f531/"
style="text-decoration: none; font-size: 10px; margin: 0;"
>
<img src="https://pikwizard.com/pw/medium/d6a3e64be73e9a9bf5123c43e664f531.jpg" style="margin: 0; width: 100%;" alt="" />
<p style="font-size: 12px; margin: 0;">PikWizard</p>
</a>
</span>
</span>
Free (free of charge)
Free for personal and commercial use.
Author: Authentic Images
Similar Free Stock Images

Premium


Premium


Premium


Premium


Premium


Premium


Premium


Premium


Premium


Premium


Premium


Premium


Premium


Premium


Premium


Premium


Premium


Premium


Premium


Premium


Premium


Premium


Premium


Premium