
- Home >
- Stock Photos >
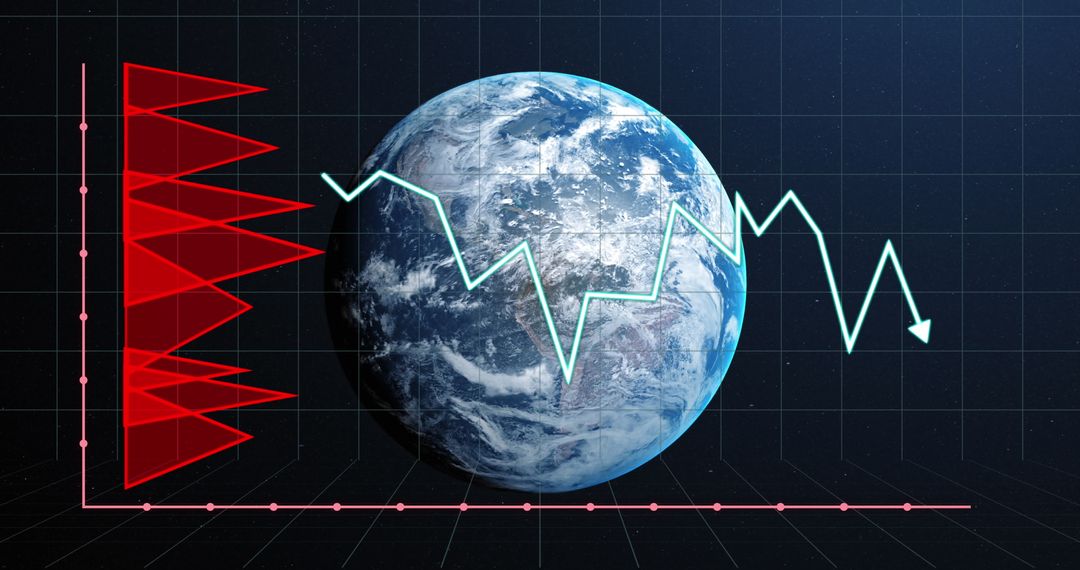
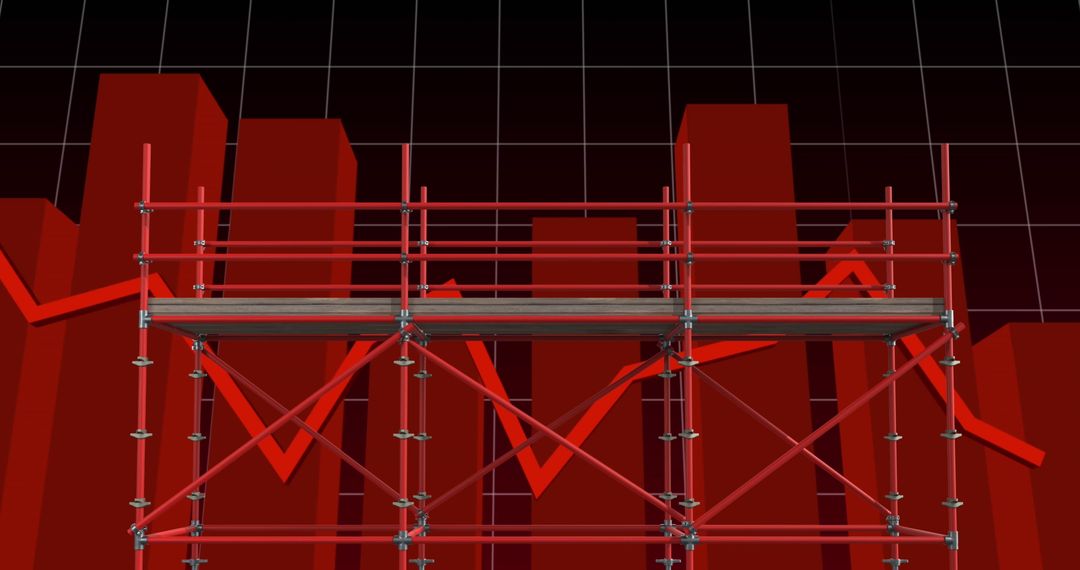
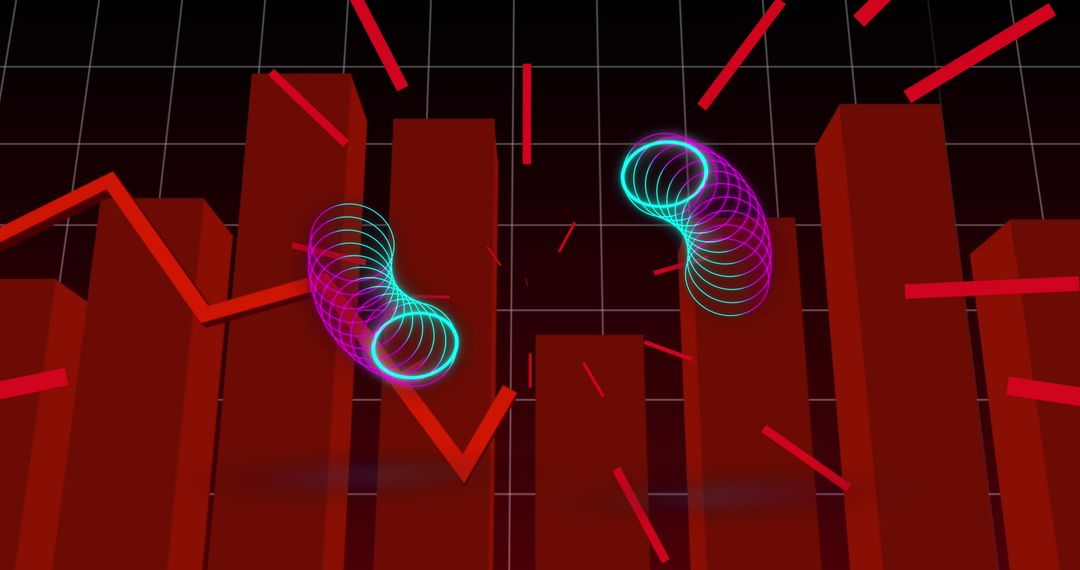
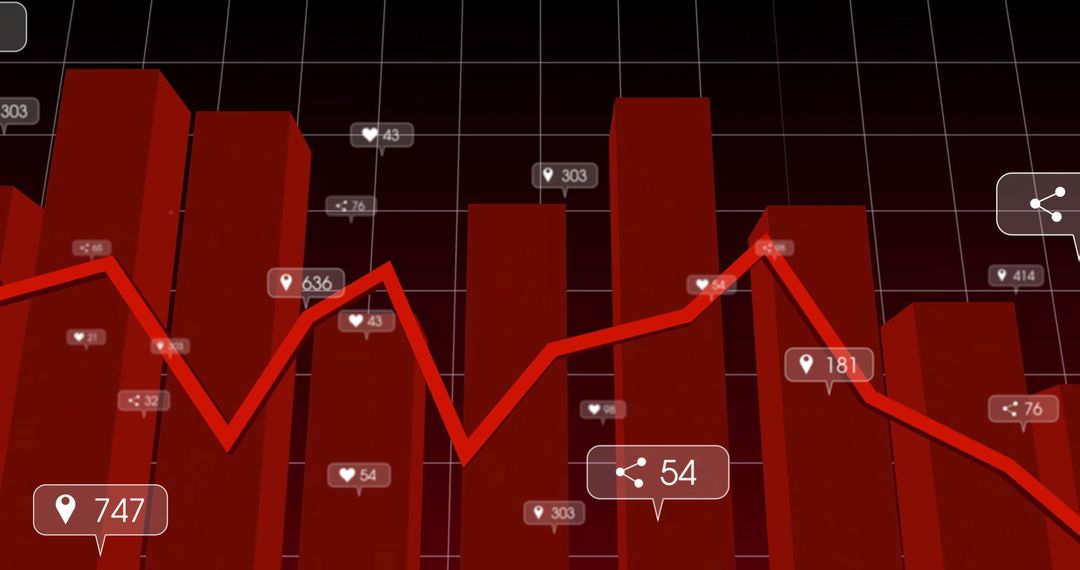
- Global Market Drop Visualization with Red 3D Bar Chart and Line Graph over Earth
Global Market Drop Visualization with Red 3D Bar Chart and Line Graph over Earth Image
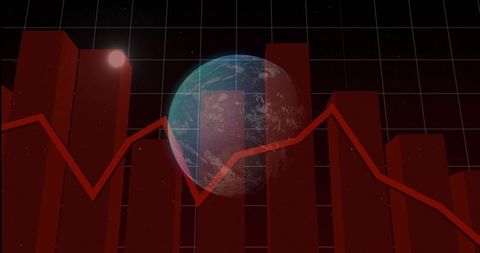
Featuring Earth globe hovering behind translucent red 3D bar chart with jagged red line graph crossing foreground. Thin grid overlay adding retro digital dashboard look and subtle starfield depth. Composition suggesting global market decline, financial analytics, and data-driven storytelling for urgent trend communication. Use for financial news graphics, economic analysis, market reports, corporate presentations, website hero banners, blog headers about recession or market volatility, fintech dashboard backgrounds, investor briefing slides, marketing materials, infographic templates. Color palette and dramatic contrast working well for urgent alerts, trend reports, crisis communications, climate economics pieces. Design tips: crop to panoramic layout for banner use, increase bar opacity for print, place headline text over dark upper area for strong legibility, convert to monochrome for subtle background. Visual focus at globe providing clear area for logo or call-to-action placement.
Powered by  - Get 15% off with code: PIKWIZARD15


0
downloads
downloads
Tags:
More
Credit Photo
If you would like to credit the Photo, here are some ways you can do so
Text Link
photo Link
<span class="text-link">
<span>
<a target="_blank" href=https://pikwizard.com/photo/global-market-drop-visualization-with-red-3d-bar-chart-and-line-graph-over-earth/6a7e3666fbb5e315575b93dcac732af9/>PikWizard</a>
</span>
</span>
<span class="image-link">
<span
style="margin: 0 0 20px 0; display: inline-block; vertical-align: middle; width: 100%;"
>
<a
target="_blank"
href="https://pikwizard.com/photo/global-market-drop-visualization-with-red-3d-bar-chart-and-line-graph-over-earth/6a7e3666fbb5e315575b93dcac732af9/"
style="text-decoration: none; font-size: 10px; margin: 0;"
>
<img src="https://pikwizard.com/pw/medium/6a7e3666fbb5e315575b93dcac732af9.jpg" style="margin: 0; width: 100%;" alt="" />
<p style="font-size: 12px; margin: 0;">PikWizard</p>
</a>
</span>
</span>
Free (free of charge)
Free for personal and commercial use.
Author: Awesome Content
Similar Free Stock Images

Premium


Premium


Premium


Premium


Premium


Premium


Premium


Premium


Premium


Premium


Premium


Premium


Premium


Premium


Premium


Premium


Premium


Premium


Premium


Premium


Premium


Premium


Premium


Premium

