- Home >
- Stock Photos >
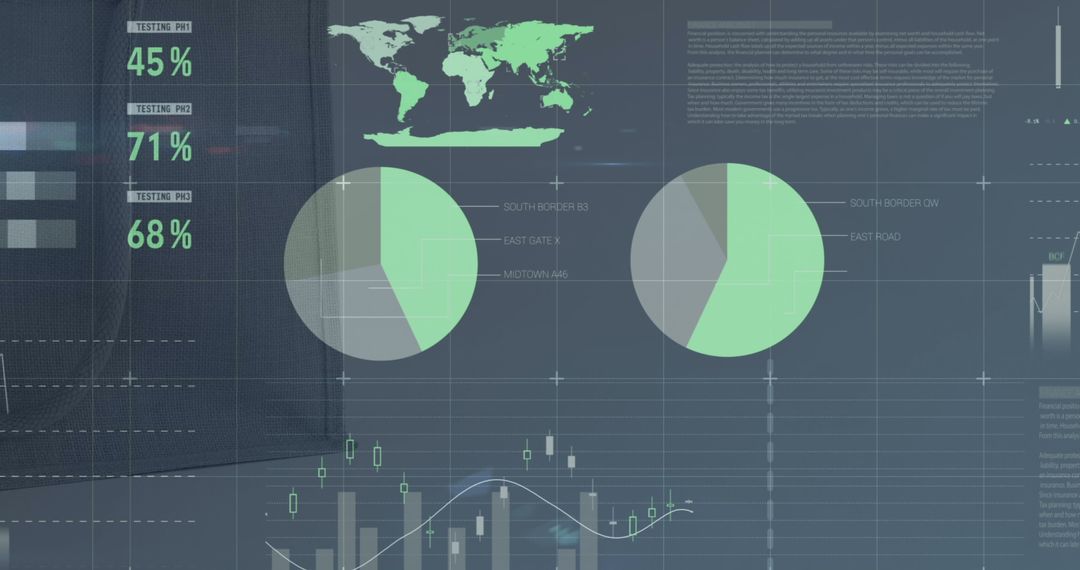
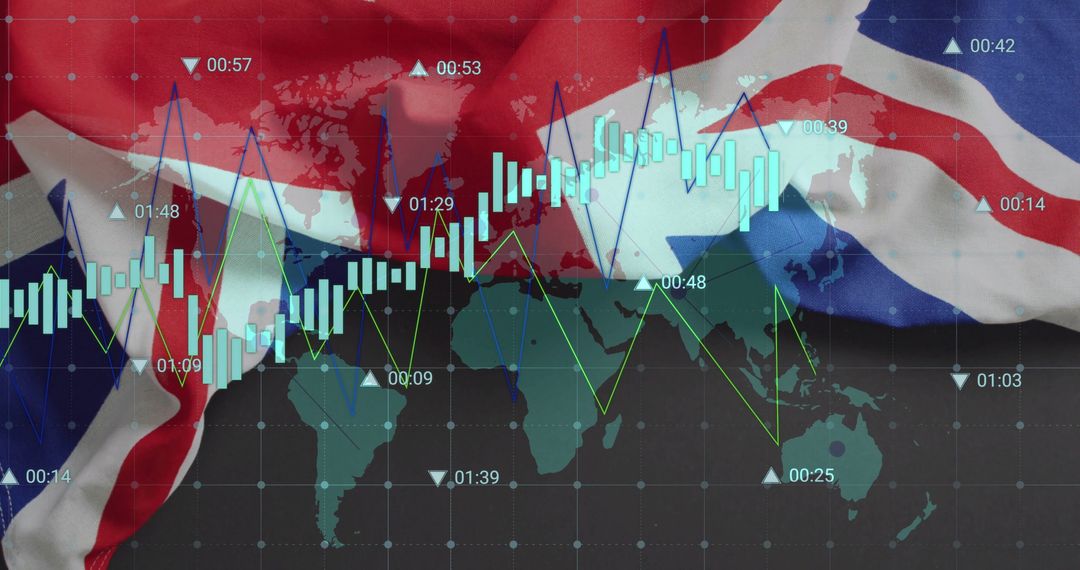
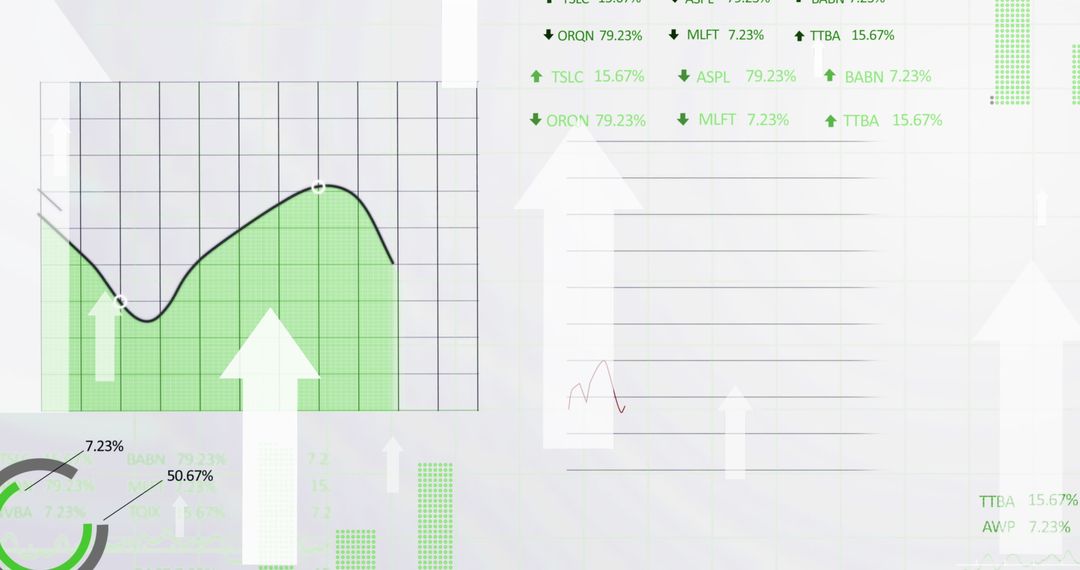
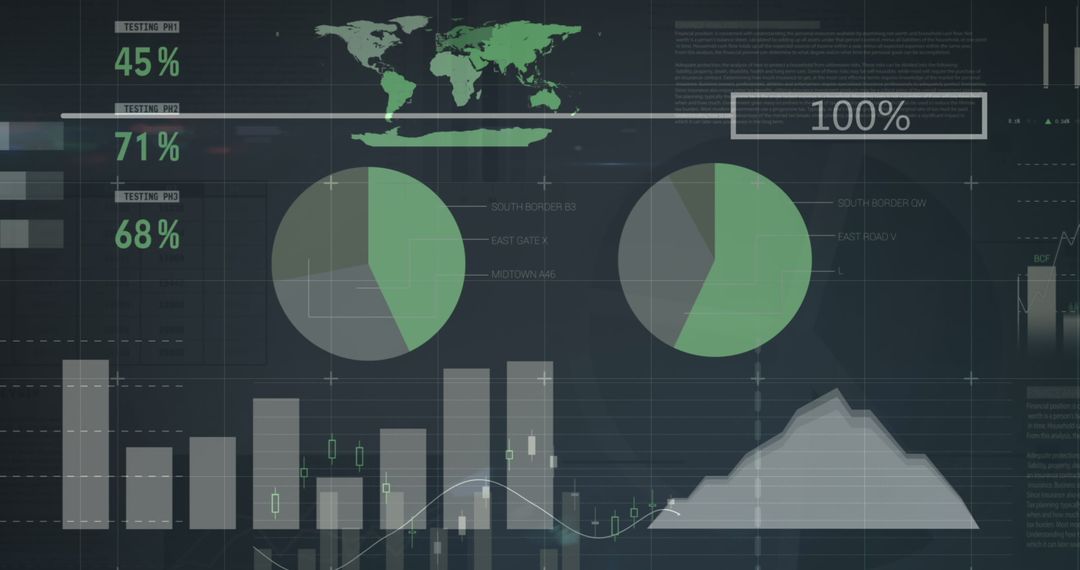
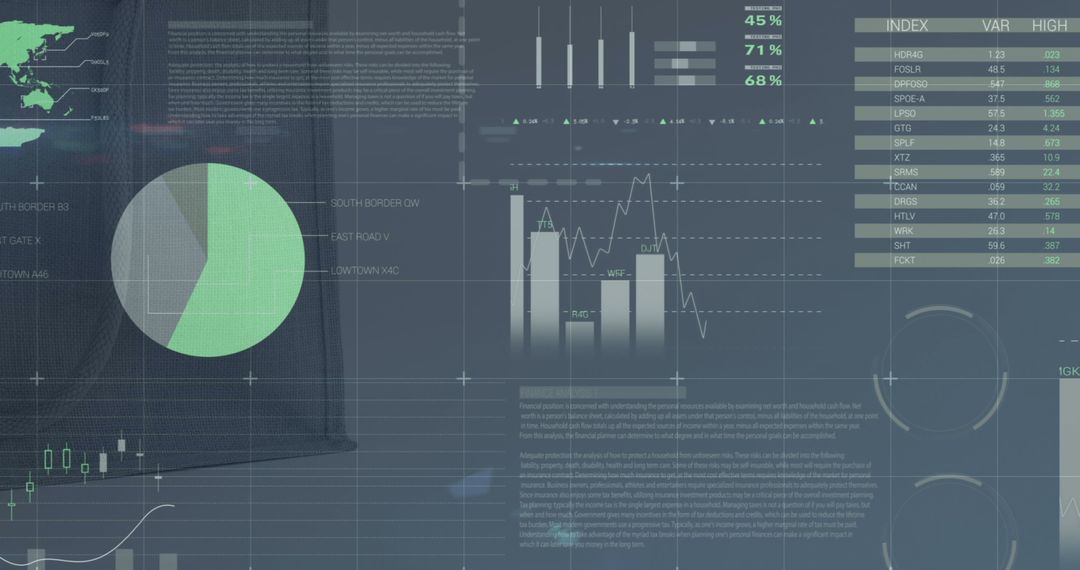
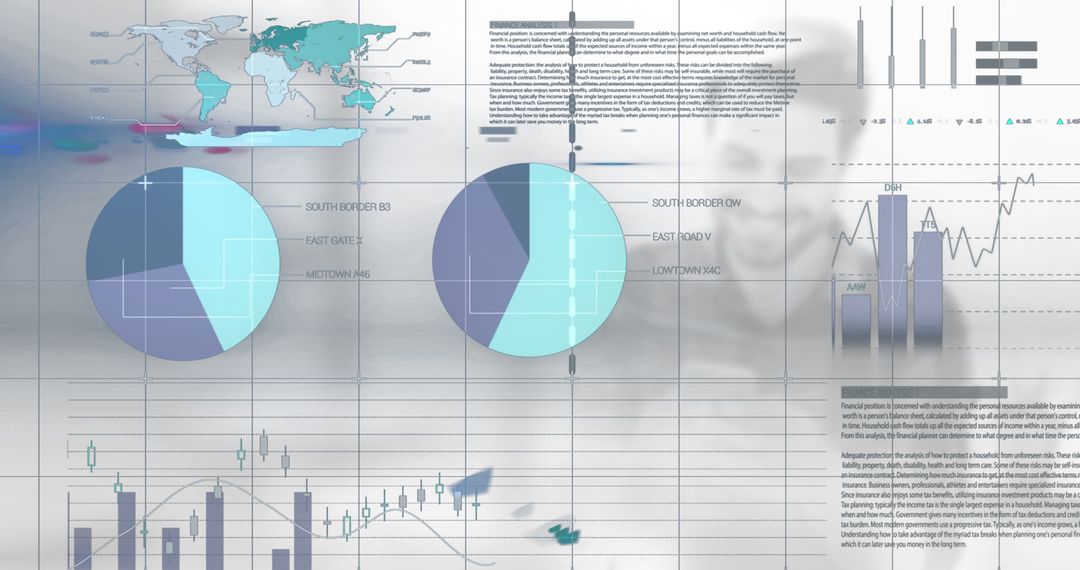
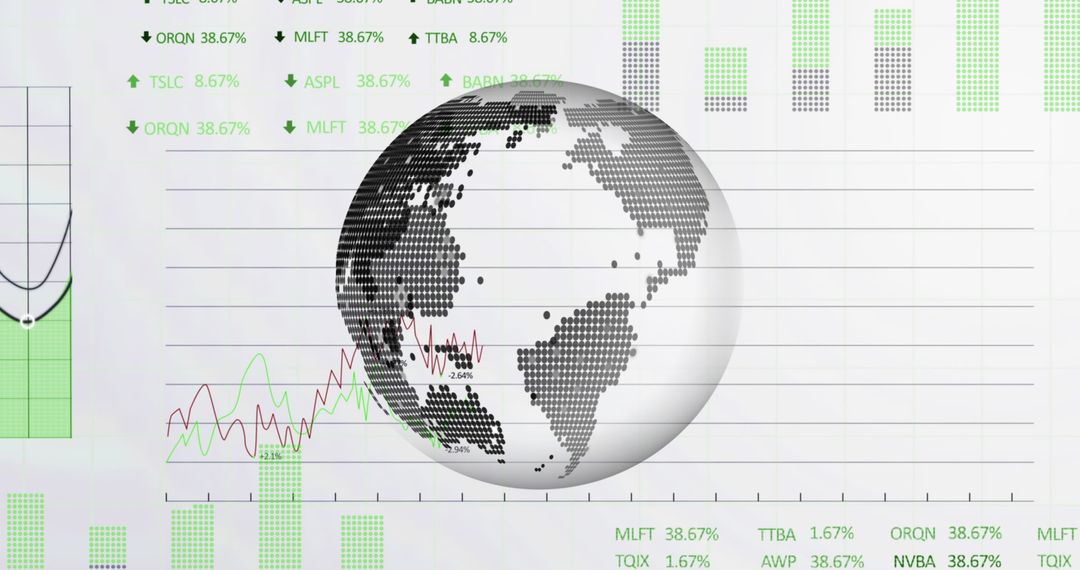
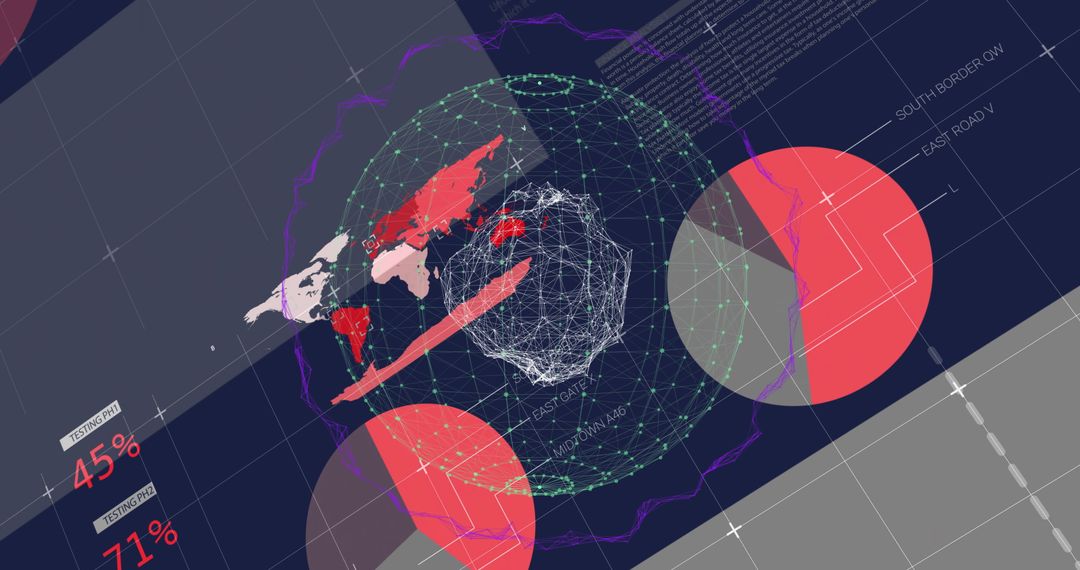
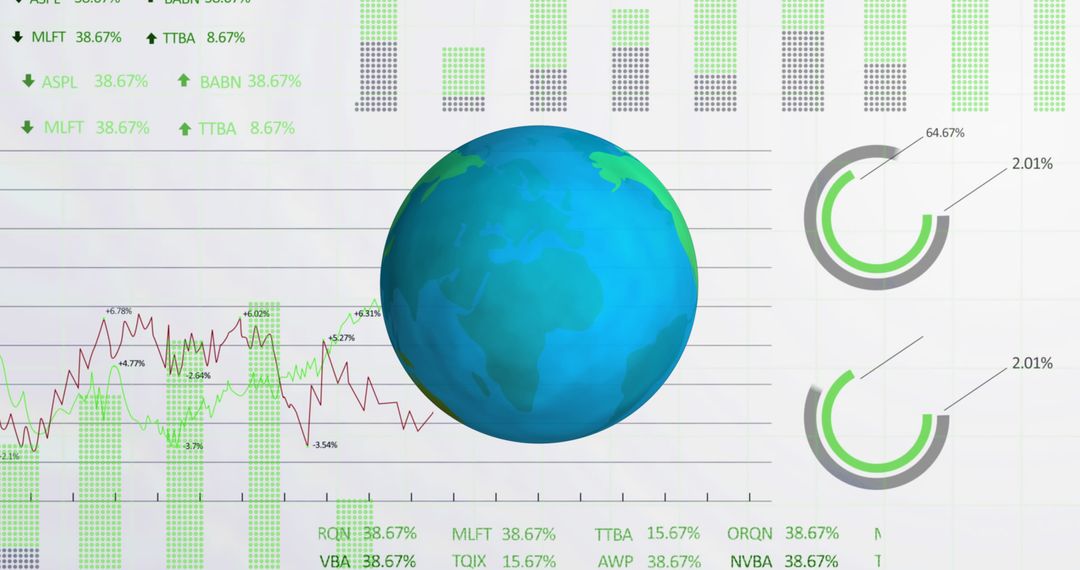
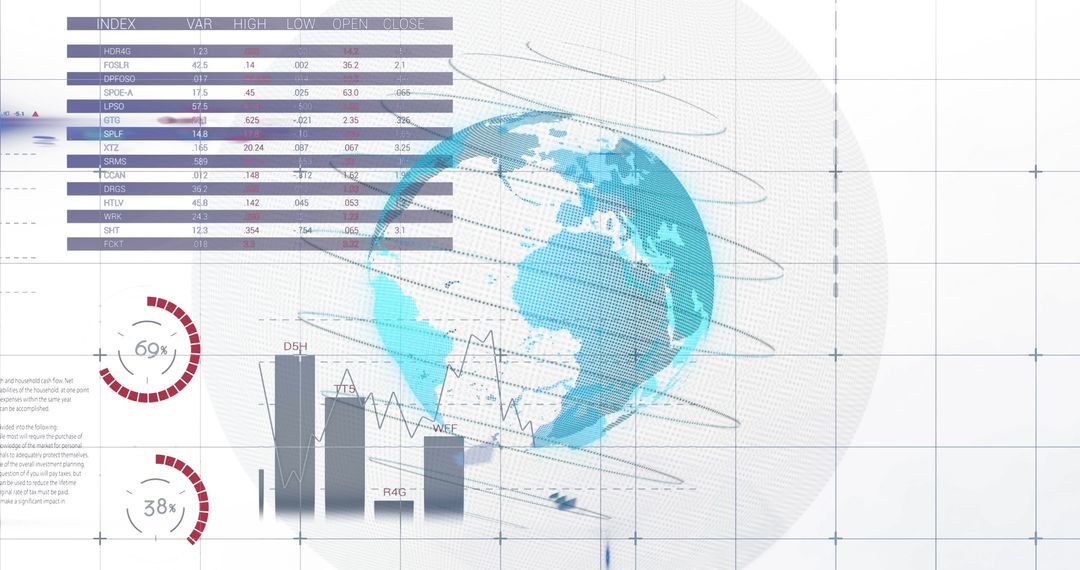
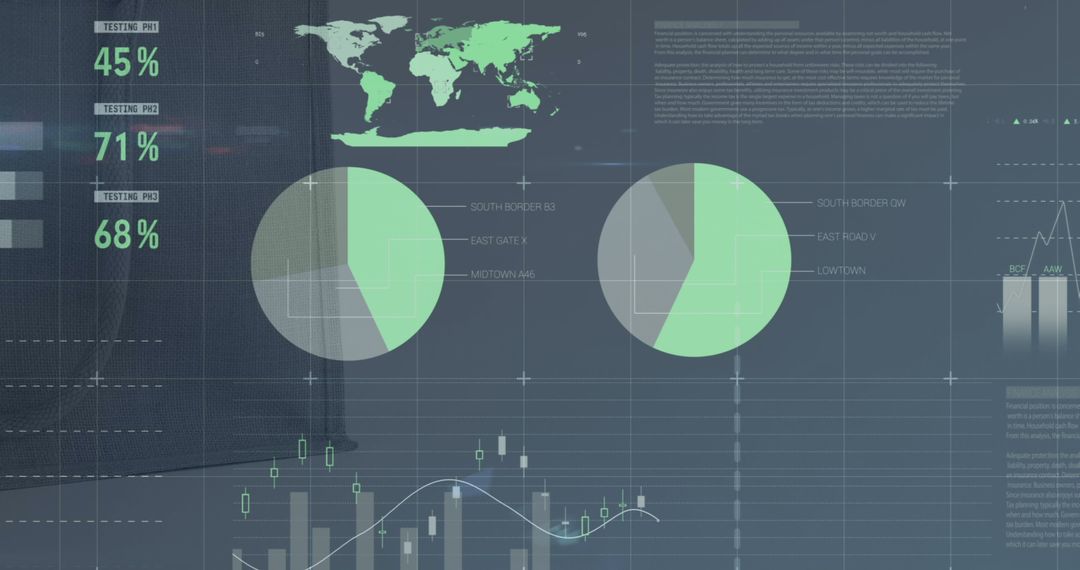
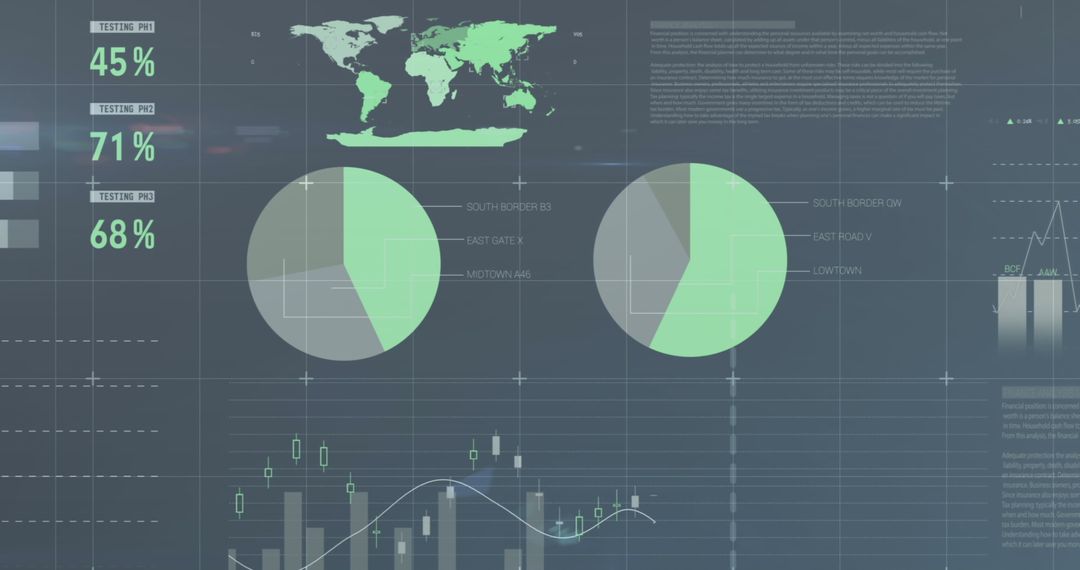
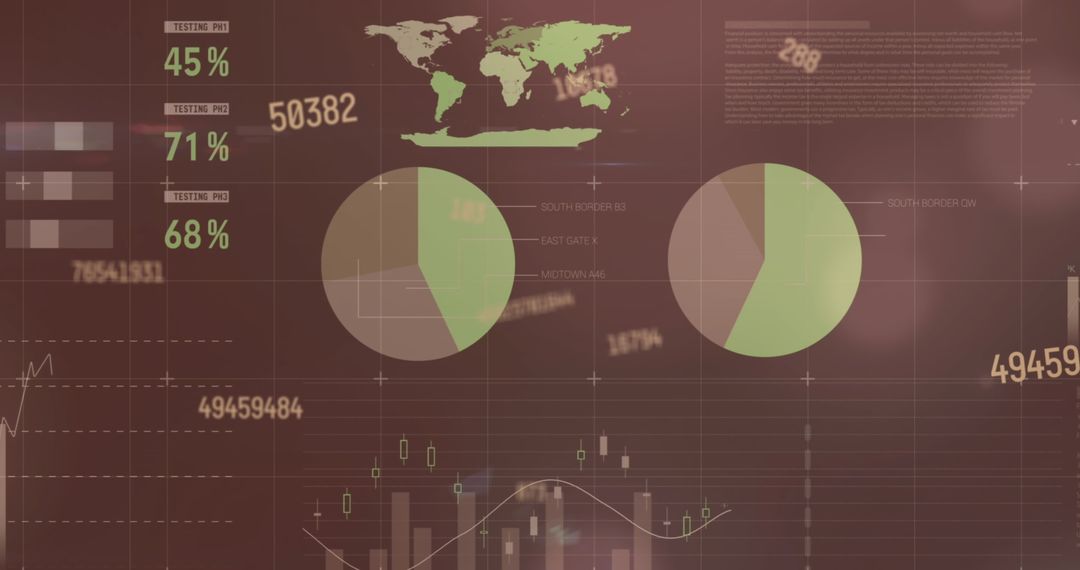
- Global Market Dynamics with Stock Data and Cameroonian Flag
Global Market Dynamics with Stock Data and Cameroonian Flag Image
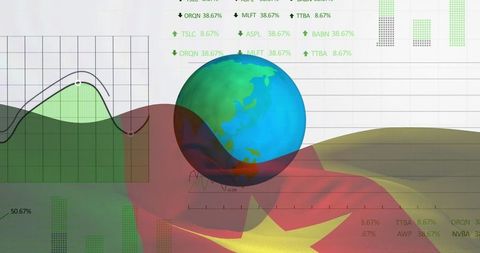
Visual depicting integration of global financial data with a spinning globe behind a translucent Cameroonian flag. Symbol of economic connectivity and business dynamics, ideal for illustrating international investment analysis concepts and global market impact for educational purposes, finance articles, or business presentations.
Powered by 


2
downloads
downloads
Tags:
More
Credit Photo
If you would like to credit the Photo, here are some ways you can do so
Text Link
photo Link
<span class="text-link">
<span>
<a target="_blank" href=https://pikwizard.com/photo/global-market-dynamics-with-stock-data-and-cameroonian-flag/f2b4e4ea19b5e659f7cf53447f7070b7/>PikWizard</a>
</span>
</span>
<span class="image-link">
<span
style="margin: 0 0 20px 0; display: inline-block; vertical-align: middle; width: 100%;"
>
<a
target="_blank"
href="https://pikwizard.com/photo/global-market-dynamics-with-stock-data-and-cameroonian-flag/f2b4e4ea19b5e659f7cf53447f7070b7/"
style="text-decoration: none; font-size: 10px; margin: 0;"
>
<img src="https://pikwizard.com/pw/medium/f2b4e4ea19b5e659f7cf53447f7070b7.jpg" style="margin: 0; width: 100%;" alt="" />
<p style="font-size: 12px; margin: 0;">PikWizard</p>
</a>
</span>
</span>
Free (free of charge)
Free for personal and commercial use.
Author: Awesome Content
Similar Free Stock Images
Premium


Premium


Premium


Premium


Premium


Premium


Premium


Premium


Premium


Premium


Premium


Premium


Premium


Premium


Premium


Premium


Premium


Premium


Premium


Premium


Premium


Premium


Premium


Premium