- Home >
- Stock Photos >
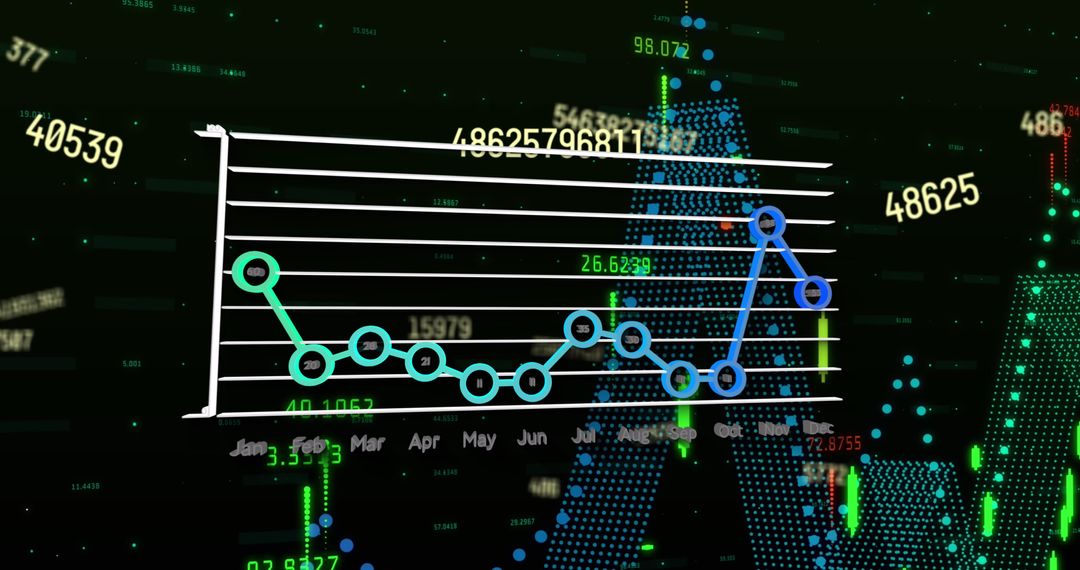
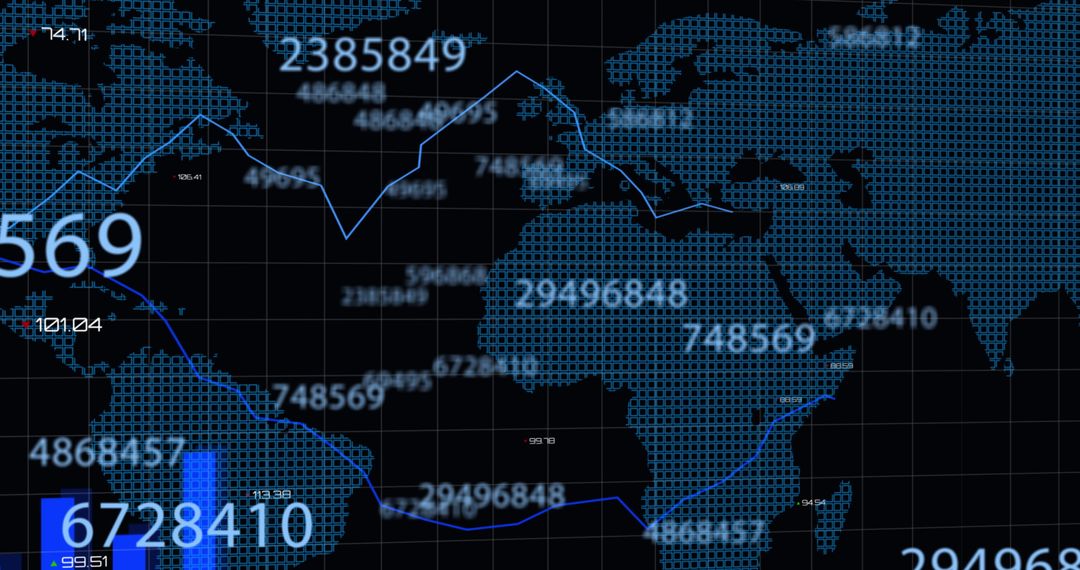
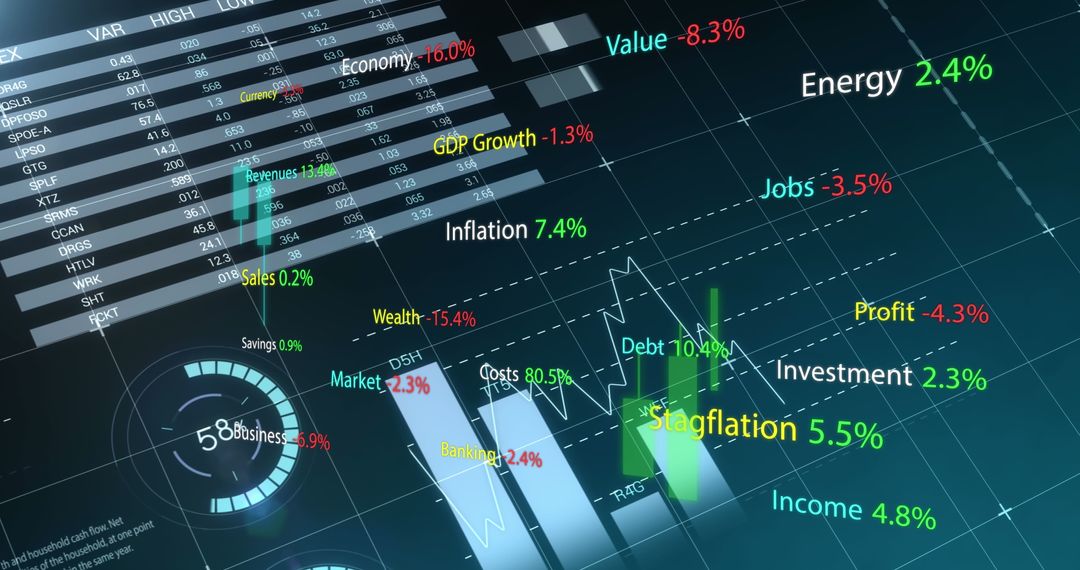
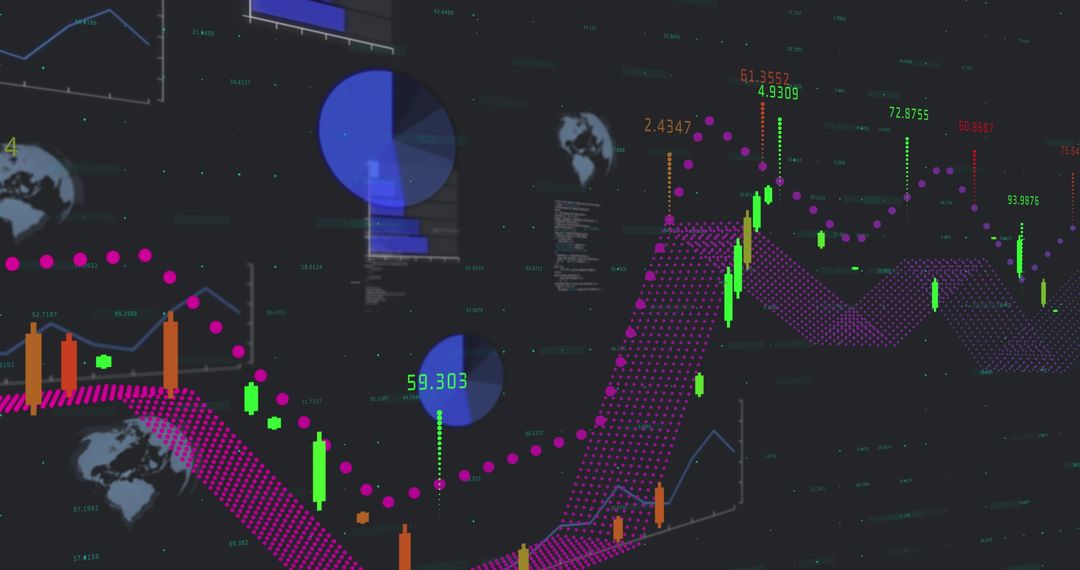
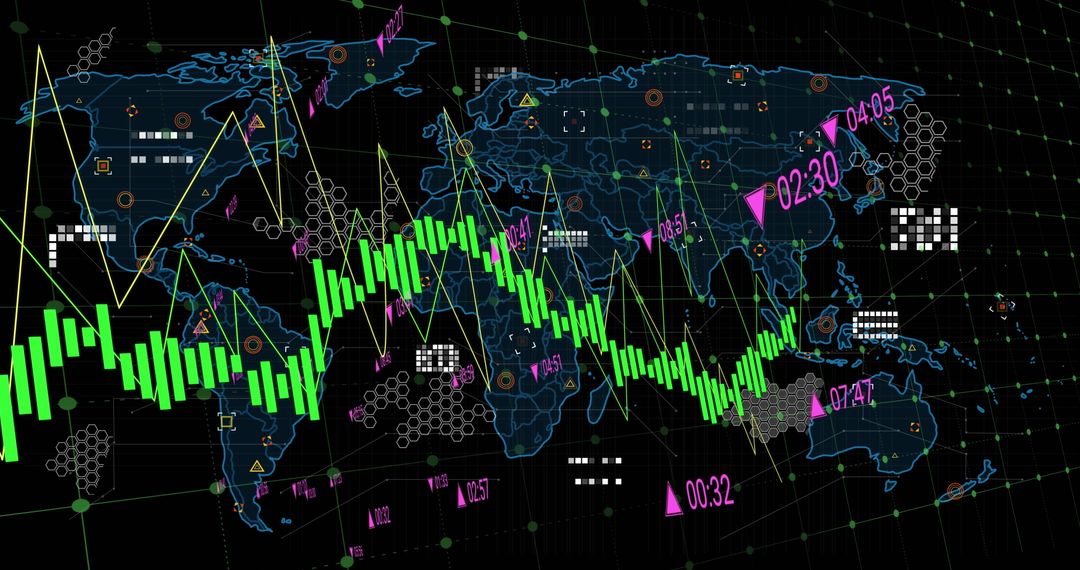
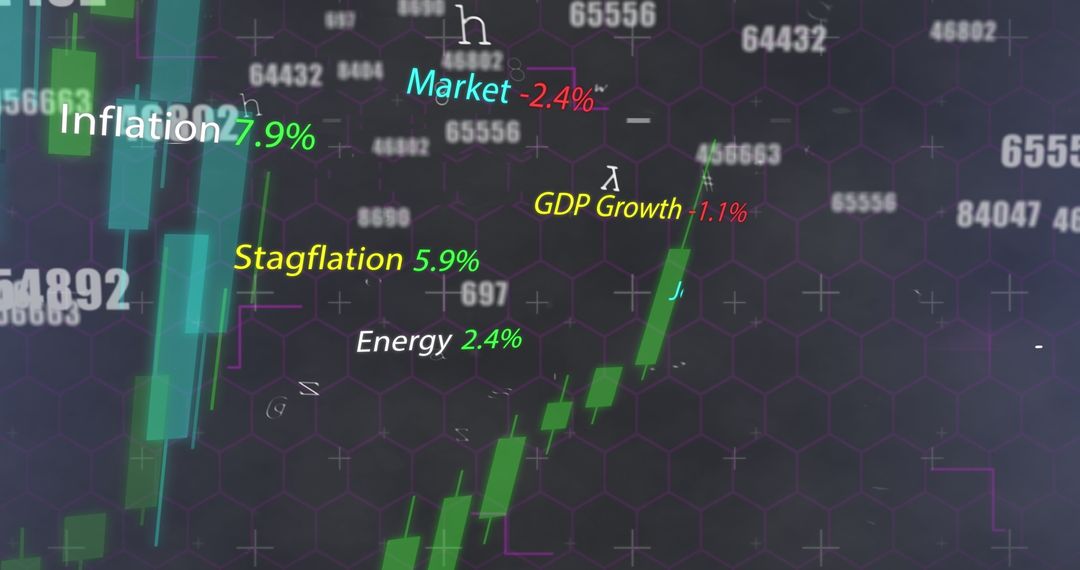
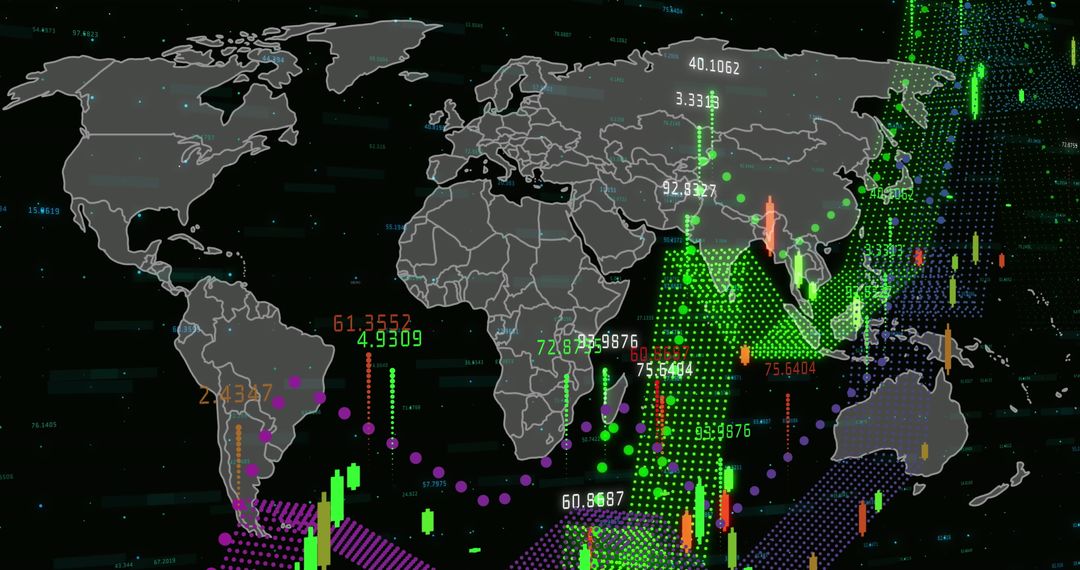
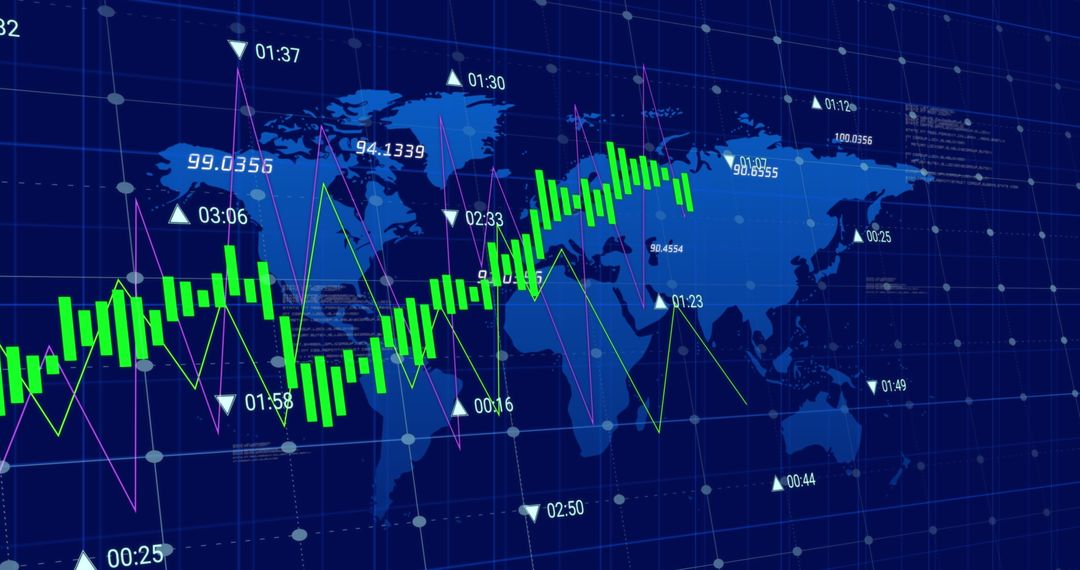
- Global Market Trends Data Visualization with Business Metrics Overlay
Global Market Trends Data Visualization with Business Metrics Overlay Image
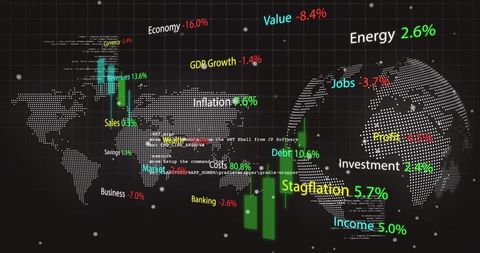
Visualization depicts global business trends with text showing various metrics like GDP Growth, Inflation, Value, and more against a world map backdrop. Useful for presentations on global economic analysis, market research reports, or digital marketing materials showcasing data interpretation.
Powered by  - Get 15% off with code: PIKWIZARD15


2
downloads
downloads
Tags:
More
Credit Photo
If you would like to credit the Photo, here are some ways you can do so
Text Link
photo Link
<span class="text-link">
<span>
<a target="_blank" href=https://pikwizard.com/photo/global-market-trends-data-visualization-with-business-metrics-overlay/d1d81bbd50539d903dc899097e4112d7/>PikWizard</a>
</span>
</span>
<span class="image-link">
<span
style="margin: 0 0 20px 0; display: inline-block; vertical-align: middle; width: 100%;"
>
<a
target="_blank"
href="https://pikwizard.com/photo/global-market-trends-data-visualization-with-business-metrics-overlay/d1d81bbd50539d903dc899097e4112d7/"
style="text-decoration: none; font-size: 10px; margin: 0;"
>
<img src="https://pikwizard.com/pw/medium/d1d81bbd50539d903dc899097e4112d7.jpg" style="margin: 0; width: 100%;" alt="" />
<p style="font-size: 12px; margin: 0;">PikWizard</p>
</a>
</span>
</span>
Free (free of charge)
Free for personal and commercial use.
Author: Creative Art
Similar Free Stock Images
Premium


Premium


Premium


Premium


Premium


Premium


Premium


Premium


Premium


Premium


Premium


Premium


Premium


Premium


Premium


Premium


Premium


Premium


Premium


Premium


Premium


Premium


Premium


Premium