- Home >
- Stock Photos >
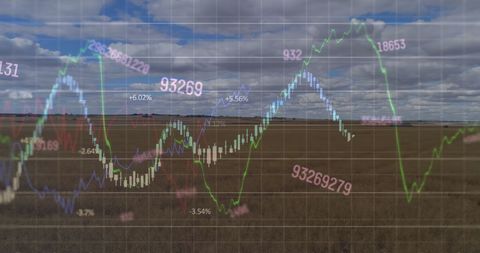
- Global Networking and Data Visualization Over Stormy Sky
Global Networking and Data Visualization Over Stormy Sky Image

Conceptual illustration of digital graphs and data analytics overlaying electricity pylons against stormy night sky. Powerful depiction of technology intersecting with infrastructure. Ideal for themes of global networking, technology, data analysis, energy industry, and abstract data art in presentations or digital media.

downloads
Tags:
More
Credit Photo
If you would like to credit the Photo, here are some ways you can do so
Text Link
photo Link
<span class="text-link">
<span>
<a target="_blank" href=https://pikwizard.com/photo/global-networking-and-data-visualization-over-stormy-sky/70fba7925bbd9d428667f9cf65828673/>PikWizard</a>
</span>
</span>
<span class="image-link">
<span
style="margin: 0 0 20px 0; display: inline-block; vertical-align: middle; width: 100%;"
>
<a
target="_blank"
href="https://pikwizard.com/photo/global-networking-and-data-visualization-over-stormy-sky/70fba7925bbd9d428667f9cf65828673/"
style="text-decoration: none; font-size: 10px; margin: 0;"
>
<img src="https://pikwizard.com/pw/medium/70fba7925bbd9d428667f9cf65828673.jpg" style="margin: 0; width: 100%;" alt="" />
<p style="font-size: 12px; margin: 0;">PikWizard</p>
</a>
</span>
</span>
Free (free of charge)
Free for personal and commercial use.
Author: Awesome Content