
- Home >
- Stock Photos >
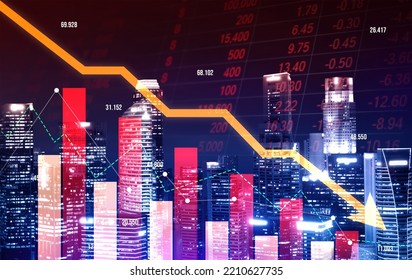
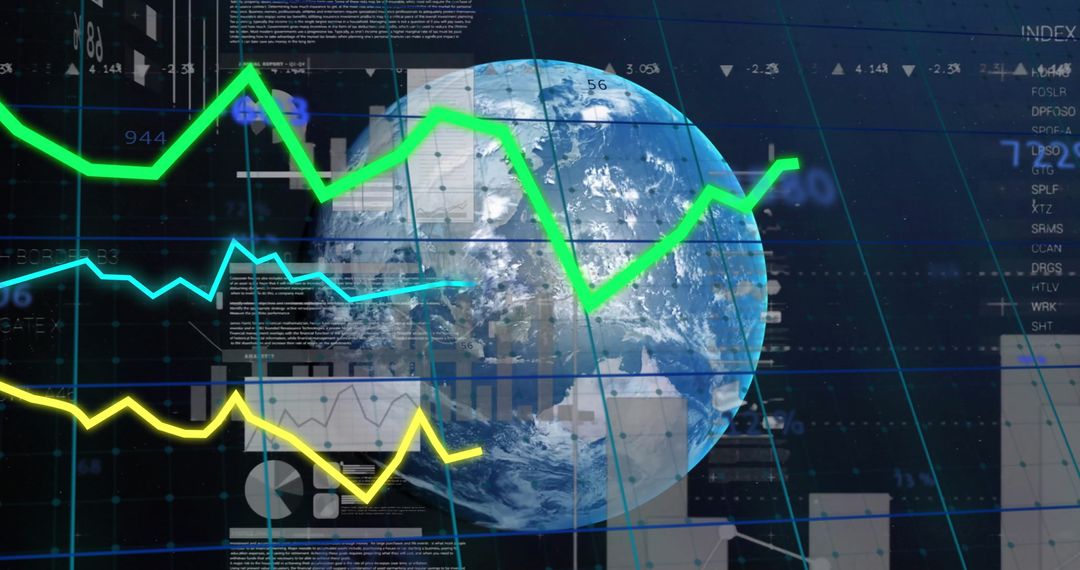
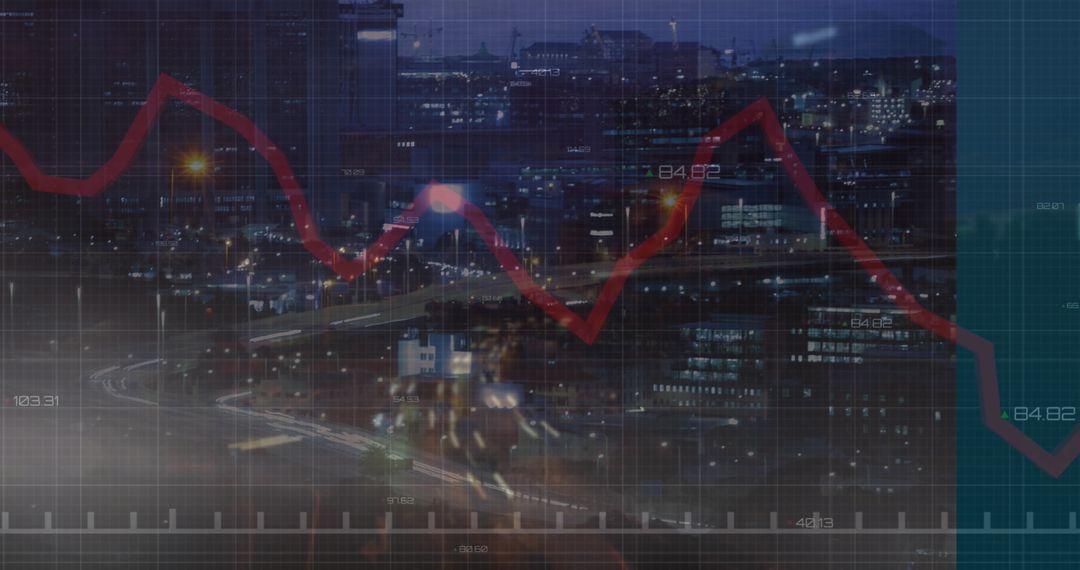
- Global Online Data Analysis with Declining Financial Trend
Global Online Data Analysis with Declining Financial Trend Image
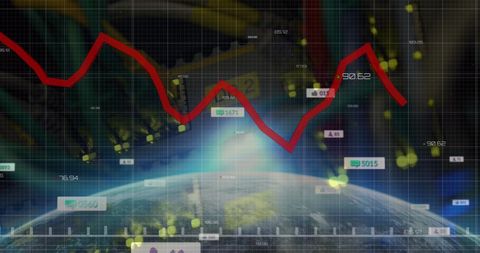
Incorporates elements symbolizing a mixture of data analysis and financial trends set against a digital projection involving server rooms. Globe presence emphasizes worldwide perspective in digital era essentials. Media icons showcase the interconnected nature of financial and data processing systems. Suitable for illustrating concepts regarding declining financial performance, urgent attention to digital transformations, global business visualization and tech-focused modern narration.
Powered by  - Get 15% off with code: PIKWIZARD15


2
downloads
downloads
Tags:
More
Credit Photo
If you would like to credit the Photo, here are some ways you can do so
Text Link
photo Link
<span class="text-link">
<span>
<a target="_blank" href=https://pikwizard.com/photo/global-online-data-analysis-with-declining-financial-trend/f759099f623e73e45e26f070725ffcb7/>PikWizard</a>
</span>
</span>
<span class="image-link">
<span
style="margin: 0 0 20px 0; display: inline-block; vertical-align: middle; width: 100%;"
>
<a
target="_blank"
href="https://pikwizard.com/photo/global-online-data-analysis-with-declining-financial-trend/f759099f623e73e45e26f070725ffcb7/"
style="text-decoration: none; font-size: 10px; margin: 0;"
>
<img src="https://pikwizard.com/pw/medium/f759099f623e73e45e26f070725ffcb7.jpg" style="margin: 0; width: 100%;" alt="" />
<p style="font-size: 12px; margin: 0;">PikWizard</p>
</a>
</span>
</span>
Free (free of charge)
Free for personal and commercial use.
Author: People Creations
Similar Free Stock Images

Premium


Premium


Premium


Premium


Premium


Premium


Premium


Premium


Premium


Premium


Premium


Premium


Premium


Premium


Premium


Premium


Premium


Premium


Premium


Premium


Premium


Premium


Premium


Premium

