1. Home > 
  2. Stock Photos > 
  3. Global Pandemic Trends Displayed on Dynamic Data Dashboard

Global Pandemic Trends Displayed on Dynamic Data Dashboard Image

Global Pandemic Trends Displayed on Dynamic Data Dashboard

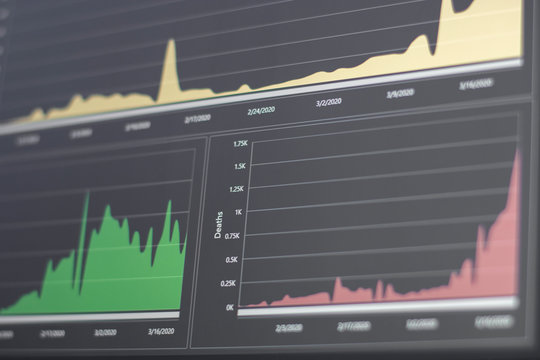
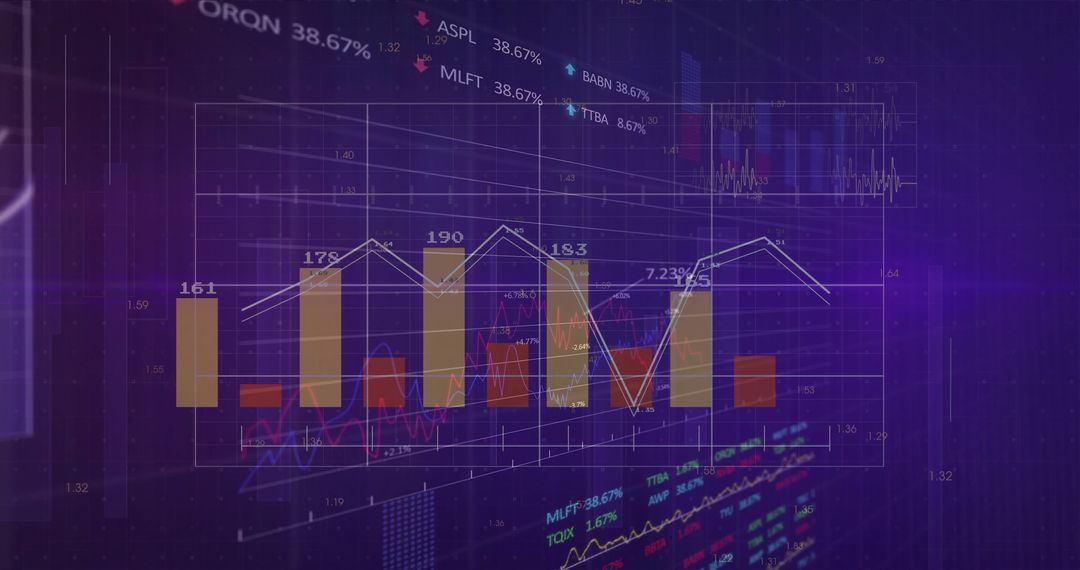
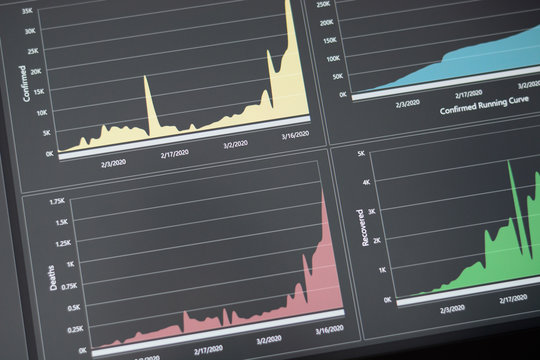
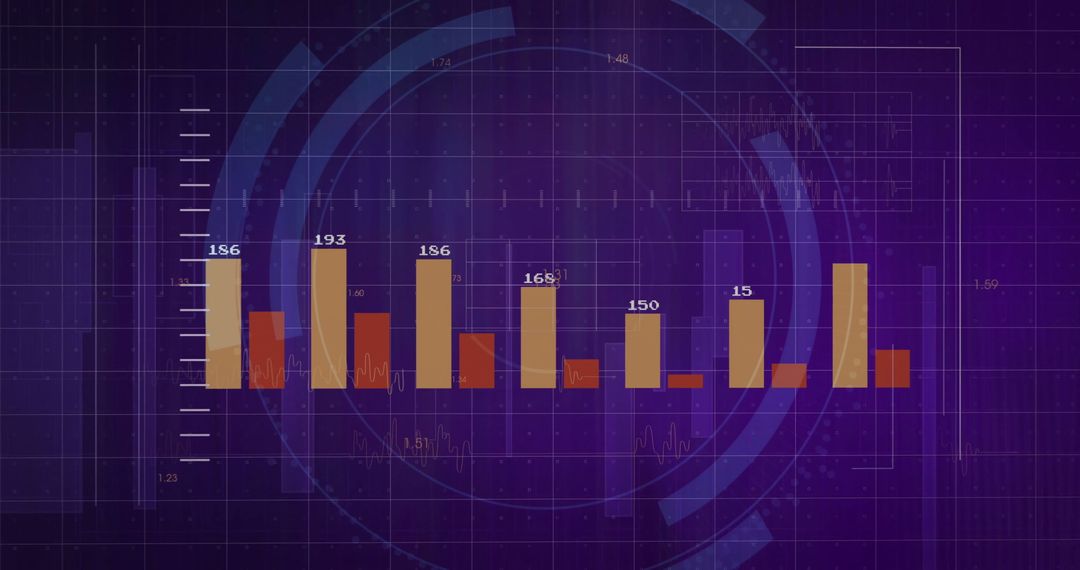
Visualization depicts global pandemic trends using a dynamic data dashboard. Features descending bar chart and trend line overlaid on world map, conveying global impacts. Virus icons emphasize medical context, ideal for presentations, reports, or articles on health analytics. Suitable for educators, researchers, or journalists needing visual data representation related to pandemic analysis and information technology.

Powered by Adobe logo
Futuristic Vaccine Development in High Tech Biotechnology Lab with Digital Screens Tracking Virus Evolution - Powered by AdobeEpidemiologist Analyzing Digital Map to Track and Predict Global Disease Outbreaks - Powered by AdobeCoronavirus infections visualization shown in a graphical dashboard. Pandemic curve infectious diseases. Confirmed, deaths and recovered cases worldwide. Data analytics medical data. - Powered by Adobedigital interface displaying global health dashboard with virus visualization, showcasing data analytics and health metrics. image conveys urgency and technological advancement - Powered by AdobeEmpty streets of downtown Raleigh, North Carolina, with closed shops and restaurants, during the COVID-19 pandemic, highlighting the economic impact on local businesses. - Powered by Adobe

Credit Photo

If you would like to credit the Photo, here are some ways you can do so

Free (free of charge)

Free for personal and commercial use.

Author: Authentic Images

Similar Free Stock Images

Global Pandemic Analysis with Red Bar Graph and World Map
Premium
Person analyzing virus data on smartphone screen with futuristic dashboard displaying global health statistics and outbreak information
Digital Interface Graph with Coronavirus Cells Among Data
Futuristic Digital Interface with City Overlay and Data Graphs
Abstract Global Finance with Rotating Globe and Data Graphs
Digital Representation of Data Processing in Global Business
Premium
Researcher Interacting with 3D Hologram of a Virus Protein Structure
Digital Interface with Molecular Data Visualization
Digital Charts and Falling Banknotes Amid Pandemic Crisis
Digital Data Interface on Covid-19 Pandemic Trends
Digital Interface Globe with Data and Graphs Overlay
Premium
AI Powered Biosecurity Center Monitoring Global Health Threats with Holographic Data Visualizations
Futuristic Data Analytics with Computer Circuitry
Futuristic Technology and Stock Market Analysis Background
Global Digital Interface with Data Processing Overlay
Futuristic Digital Interface with Cityscape and Data Analysis Overlay
Premium
Comprehensive Digital Monitoring of Coronavirus Pandemic and Disease Control
Digital Security Concept with Fingerprint and Lock Icon
Digital Global Financial Data with World Map Overlay
Digital Connection Network with Global Business Data Streams
Global Financial Data Analysis and Technology Trends
Premium
Digital dashboard tracking global outbreak data
Financial Data Graphic with Rising Trends on Digital Grid
Futuristic Financial Data Analysis with Global Technology Integration
Global Digital Network Amid Data Visualization Sparks
Global Data Network with Interactive Digital World Map
Premium
Digital health analytics featuring a coronavirus model, data visualization, graphs, and technology insights showcasing real-time health monitoring and pandemic data tracking
Global Financial Dashboard with Red Downward Trend Line Graph
Global Map with Data Connections and Illuminated Nodes
Stock Market Data Visualization With Bar and Line Graphs
City Skyline with Overlaying Financial Charts
COVID-19 Data with Red Graph Demonstrating Rising Statistics
Coronavirus Data Analysis Highlighting Pandemic Impact Trends
Premium
A healthcare professional in protective gear analyzes virus data on a high-tech screen, highlighting the urgency and complexity of pandemic response.
Global Financial Data and Digital Interface Concept
Global Financial Data and Graphs Over Digital Globe Interface
Visualizing Stock Market and Data Analytics Trends
Digital Interface with Financial Data and User Visualization
Premium
Monitoring covid-19 data trends health analytics center infographic dashboard digital environment back view data visualization
Word Cloud of Coronavirus Themes with Statistical Graphics
Dynamic Global Data Network Visualization in Blue Tones
Futuristic Digital Interface with Global Financial Data
Abstract Financial Data Visualization with Global Connections
Premium
A public health official is analyzing population health management data
Global Economy and Technology Interconnectedness
Futuristic Data Processing Visualization with Graphs and Charts
Digital Financial Data with Illuminated Graph on Blue Interface
Futuristic Data Analytics and Visualization Interface
Premium
Cutting Edge Remote Diagnostic Medical Devices with Advanced Monitoring and Analytics Capabilities for Improved Patient Care and Telemedicine during Healthcare Emergencies
Digital World Map with Data Visualization Elements
Digital Charts Highlighting Global Finance Data Insights
Global Financial Data Analysis with Dynamic Graphs on World Map
Data Visualization Illustrating Market Trends with Graphs and Charts
Premium
Coronavirus infections visualization shown in a graphical dashboard. Pandemic curve infectious diseases. Confirmed, deaths and recovered cases worldwide. Data analytics medical data.
Digital Globe with Data and Network Connections Technology Concept
Digital Fingerprint Interface with Data Loading Concept
Global Networking Concept with World Map and Data Flow Lines at Night
Futuristic Digital World Map with Data Analytics Display
Premium
Unleash the Power of Science: Interactive Virtual Chemistry Set for Engaging Hands-On Learning
Encrypted Data Transfer Interface with Graphics and Charts
Digital World Map on Red Grid with Numeric Data and Connections
Global Financial Decline and Data Visualization with Red Arrow
Coronavirus Pandemic Impact with Declining Graph and Virus Cells
Digital Infographic Illustrating COVID-19 Data Statistics Pandemic Impact
Digital Interface with Graphs and Virus Cells Over Data Center
Premium
Global Business Statistics Charts Background during Pandemic
Digital Data Visualization with Global Connection Elements
Global User Data with Financial Interface on World Map
Digital Interface with Global Financial Data and User Profile
Futuristic Data Analytics with Cityscape and Digital Interfaces
Premium
Analyzing virus impact on digital data in real-time for research and analysis
Futuristic Digital Global Business Interface with Data Analytics
Futuristic Data Display Over Cityscape with Digital Interface
Global Data Analysis with Virus Imagery in Background
Futuristic Digital Data Processing on Network Grid
Premium
Detailed Visualization of a Coronavirus Model with Data Dashboard Background Representing COVID-19 Pandemic Impact on Health Systems and Society
Abstract City Traffic Analytics with Data Overlay
Digital Financial Data Chart with Declining Trend over Blue Background
Financial Data Visualization with Growing Business Charts
Financial Data Analysis and Market Trends Visualization
Premium
Computer screens display a digital representation of the coronavirus, highlighting the global impact of the pandemic.
Statistics and Data Processing with Graphs and Charts
Global Data Analysis with World Map and Bar Charts Overlay
Global Networking Concept with Interface Icons and Data Statistics
Digital Data Visualization Overlaying Sports Stadium
Premium
Hightech digital display in a public health office showing statistics and trends related to virus outbreaks globally
Digital Financial Graph with Circuit Board Interface on Blue Background
Global Financial Data Visualization with Graph and Digital Interface
Digital Finance Dashboard with Rising Graph and Percentages
Futuristic Digital Cybersecurity Shield with Global Network Grid
Premium
Global Business Statistics Charts Background during Pandemic
Rising Financial Bar Chart with Virus Icons Illustrates Economic Impact
Global Financial Data Intersecting with Biotech Innovations
Digital Data and Covid-19 Conceptual Graph with Virus Cells
Dynamic Data Visualization of COVID-19 Statistics
Digital Interface Displaying Global Network Data and Security Elements
Global Financial Data Visualization with Digital Interface
Premium
Businessman analyzing stock market investments with financial dashboard,on smartphone and computer screens.Corona vaccine discovery boosts stock markets.
Financial Data and User Profiles on Global Digital Interface
Digital Rouble Symbol Amidst Data Charts and Analytics
Futuristic Interface Displaying Global Economic Data
Coronavirus Impact with Social Distancing Emphasis and Growing Chart
Premium
Global stats data concept with screen texture of digital interface and world map in the center of composition on dark technological background, hud template. 3D rendering
Financial Data Analysis Graph with Growing Trends
Digital Finance Technology with Global Interconnection
Digital Data Integration with World Map Interface Design
Global Data Analysis Over World Map with Digital Interface
Premium
Medicine doctor hand working with modern computer virtual dashboard as medical network concept Health care and medical services concept with world or global form and AR interface.
Futuristic Data Interface with Dynamic Charts and Diagrams
Dynamic Financial Graphs on Digital Screen Displaying Market Trends
Futuristic Digital Interface with Global Network Overlays
Digital Fingerprint and Data Analytics Background
Premium
Futuristic Nanotechnology Health Monitoring System Providing Detailed Disease Analysis and Early Detection
Futuristic Global Financial Data Processing Interface
Pandemic Impact Illustrated with Graph and World Graphic
Digital Interface Displaying Data Processing Analytics on Black Background
Digital 5G Technology Concept with Geometric Patterns
Premium
Digital Representation of a Virus in High-Tech Interface
Game Over in High-Tech Futuristic Interface with Digital Globe
Futuristic Financial Analytics with Candlestick Trends and Neon Lights
Digital Finance Dashboard Analyzing EconomicData Trends
Downward Trend Arrow Over Digital Trading Bar Graph Interface
Premium
Virus alert dashboard spike chart bell warning, data analytics, anomaly detection, notification, blue graph, dark background, urgent signal
Rising Health Data with Virus Icons and Business Analytics