
- Home >
- Stock Photos >
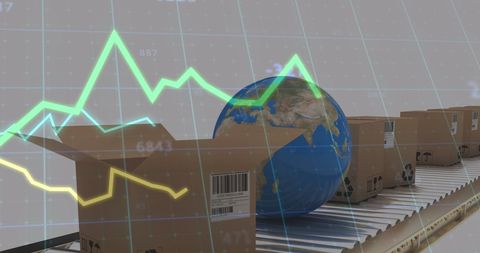
- Global Shipping Logistics and Data Analysis Integration
Global Shipping Logistics and Data Analysis Integration Image
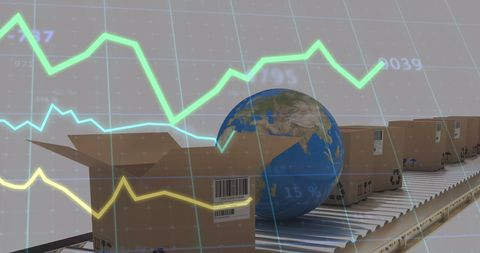
Image shows cardboard boxes and globe on conveyor belt with statistical graphs overlaid, representing integration of global logistics and data processing for efficient business operation. Useful for illustrating articles, presentations, or reports on supply chain management, economic trends, or international trade.
Powered by 


downloads
Tags:
More
Credit Photo
If you would like to credit the Photo, here are some ways you can do so
Text Link
photo Link
<span class="text-link">
<span>
<a target="_blank" href=https://pikwizard.com/photo/global-shipping-logistics-and-data-analysis-integration/d53943b4b1ced9562d75b4cdb715bbf6/>PikWizard</a>
</span>
</span>
<span class="image-link">
<span
style="margin: 0 0 20px 0; display: inline-block; vertical-align: middle; width: 100%;"
>
<a
target="_blank"
href="https://pikwizard.com/photo/global-shipping-logistics-and-data-analysis-integration/d53943b4b1ced9562d75b4cdb715bbf6/"
style="text-decoration: none; font-size: 10px; margin: 0;"
>
<img src="https://pikwizard.com/pw/medium/d53943b4b1ced9562d75b4cdb715bbf6.jpg" style="margin: 0; width: 100%;" alt="" />
<p style="font-size: 12px; margin: 0;">PikWizard</p>
</a>
</span>
</span>
Free (free of charge)
Free for personal and commercial use.
Author: Awesome Content
Similar Free Stock Images

Premium


Premium


Premium


Premium

Premium


Premium


Premium

Premium

Premium

Premium


Premium


Premium


Premium


Premium


Premium

Premium

Premium


Premium


Premium


Premium


Premium


Premium


Premium


Premium


Premium


Explore More Free Stock Images