
- Home >
- Stock Photos >
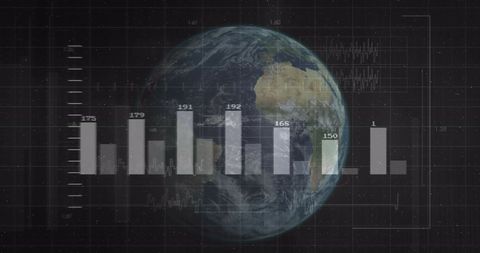
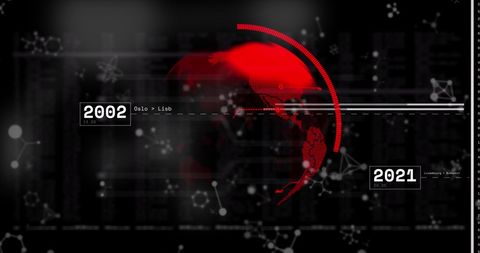
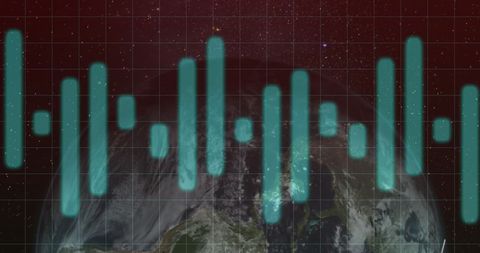
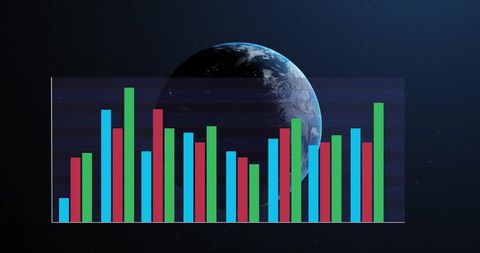
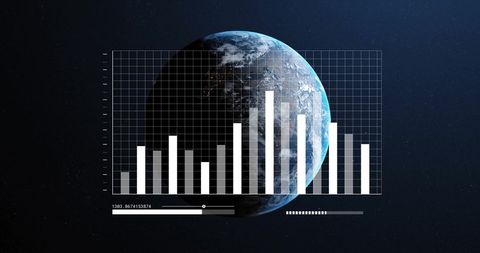
- Global Statistical Analysis Interface on Spinning Red Globe
Global Statistical Analysis Interface on Spinning Red Globe Image
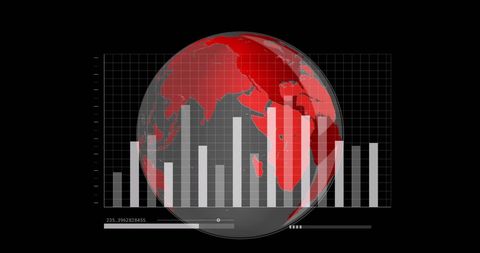
Visual represents statistical data processing over a rotating red globe contrasted on a black background. Gray and white bar graphs overlay hints at dynamic information and economic trends, suitable for illustrating concepts of international business growth, technology, or data analysis. Useful for articles, presentations, and marketing materials focusing on global markets or technological advancements.
Powered by  - Get 15% off with code: PIKWIZARD15


downloads
Tags:
More
Credit Photo
If you would like to credit the Photo, here are some ways you can do so
Text Link
photo Link
<span class="text-link">
<span>
<a target="_blank" href=https://pikwizard.com/photo/global-statistical-analysis-interface-on-spinning-red-globe/2cb1326c330cf5f5a219c5657eb65e8f/>PikWizard</a>
</span>
</span>
<span class="image-link">
<span
style="margin: 0 0 20px 0; display: inline-block; vertical-align: middle; width: 100%;"
>
<a
target="_blank"
href="https://pikwizard.com/photo/global-statistical-analysis-interface-on-spinning-red-globe/2cb1326c330cf5f5a219c5657eb65e8f/"
style="text-decoration: none; font-size: 10px; margin: 0;"
>
<img src="https://pikwizard.com/pw/medium/2cb1326c330cf5f5a219c5657eb65e8f.jpg" style="margin: 0; width: 100%;" alt="" />
<p style="font-size: 12px; margin: 0;">PikWizard</p>
</a>
</span>
</span>
Free (free of charge)
Free for personal and commercial use.
Author: Creative Art
Similar Free Stock Images

Premium


Premium


Premium


Premium


Premium


Premium


Premium


Premium


Premium


Premium

Premium

Premium


Premium


Premium

Premium

Premium


Premium


Premium


Premium


Premium

Premium


Premium


Premium


Premium


Premium


Explore More Free Stock Images