- Home >
- Stock Photos >
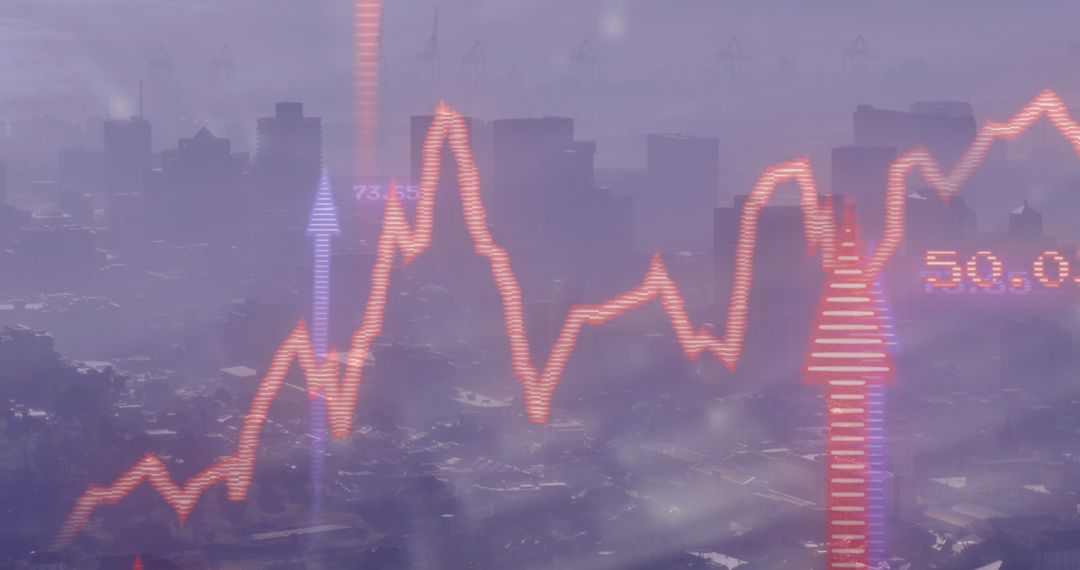
- Global Stock Market Analysis with Digital Interface Over World Map
Global Stock Market Analysis with Digital Interface Over World Map Image

Depicts digital analysis of stock market trends overlaying a world map on a blue background. Bright red and blue arrows signify market fluctuations, conveying concepts of volatility, global economy, and Finance technology. Suitable for illustrating global market reports, finance podcasts, financial analytics software, and economy-related articles. Highlights dynamic nature of modern finance.
Powered by 


2
downloads
downloads
Tags:
More
Credit Photo
If you would like to credit the Photo, here are some ways you can do so
Text Link
photo Link
<span class="text-link">
<span>
<a target="_blank" href=https://pikwizard.com/photo/global-stock-market-analysis-with-digital-interface-over-world-map/7e124f483930ad00fdd4b5ce26fca4a2/>PikWizard</a>
</span>
</span>
<span class="image-link">
<span
style="margin: 0 0 20px 0; display: inline-block; vertical-align: middle; width: 100%;"
>
<a
target="_blank"
href="https://pikwizard.com/photo/global-stock-market-analysis-with-digital-interface-over-world-map/7e124f483930ad00fdd4b5ce26fca4a2/"
style="text-decoration: none; font-size: 10px; margin: 0;"
>
<img src="https://pikwizard.com/pw/medium/7e124f483930ad00fdd4b5ce26fca4a2.jpg" style="margin: 0; width: 100%;" alt="" />
<p style="font-size: 12px; margin: 0;">PikWizard</p>
</a>
</span>
</span>
Free (free of charge)
Free for personal and commercial use.
Author: Creative Art
Similar Free Stock Images

Premium


Premium


Premium


Premium


Premium


Premium


Premium


Premium


Premium


Premium


Premium


Premium


Premium


Premium


Premium


Premium


Premium


Premium


Premium


Premium


Premium


Premium


Premium


Premium