
- Home >
- Stock Photos >
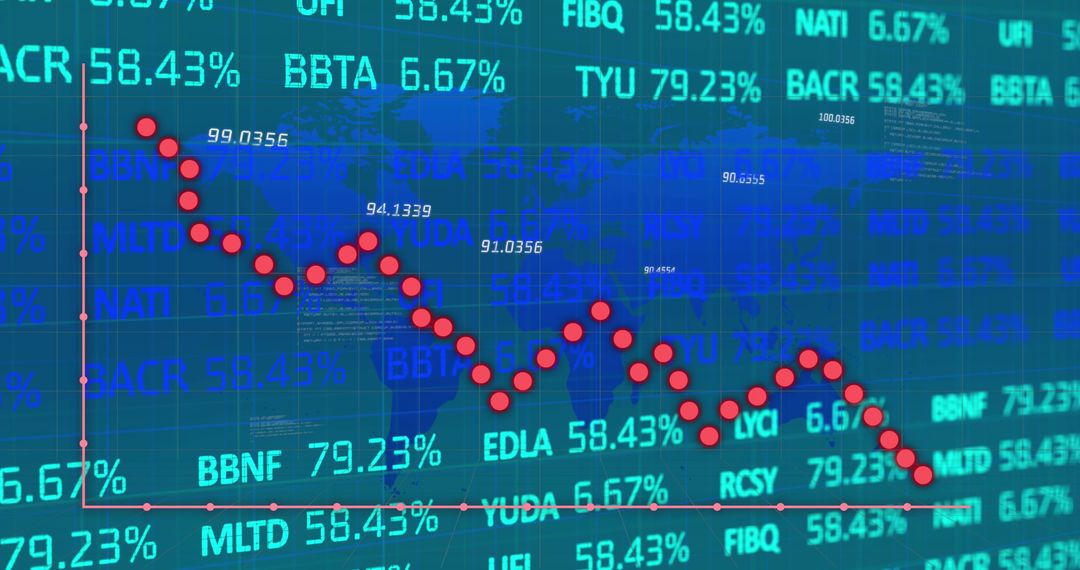
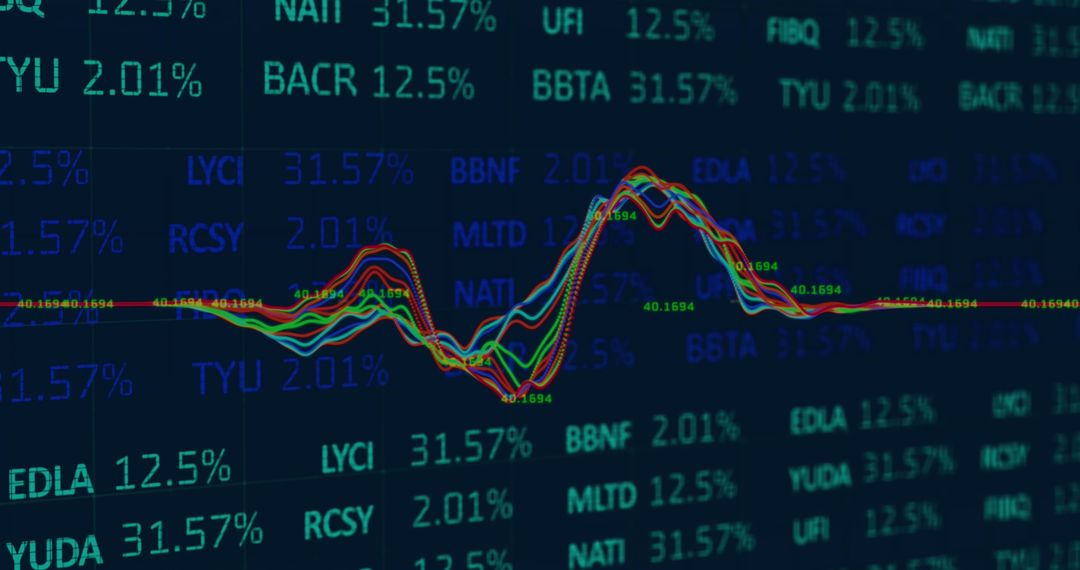
- Global Stock Market Analysis with Fluctuating Graph
Global Stock Market Analysis with Fluctuating Graph Image

This visually engaging representation of the stock market showcases a fluctuating graph overlaid on a world map, highlighting worldwide financial activities and economic trends. Useful for illustrating concepts in global business, investing strategies, digital finance transformation, or economic forecasts in presentations, reports, and financial websites.
Powered by  - Get 15% off with code: PIKWIZARD15


2
downloads
downloads
Tags:
More
Credit Photo
If you would like to credit the Photo, here are some ways you can do so
Text Link
photo Link
<span class="text-link">
<span>
<a target="_blank" href=https://pikwizard.com/photo/global-stock-market-analysis-with-fluctuating-graph/8d65ffd235fc18a9b7db9c3216e7480c/>PikWizard</a>
</span>
</span>
<span class="image-link">
<span
style="margin: 0 0 20px 0; display: inline-block; vertical-align: middle; width: 100%;"
>
<a
target="_blank"
href="https://pikwizard.com/photo/global-stock-market-analysis-with-fluctuating-graph/8d65ffd235fc18a9b7db9c3216e7480c/"
style="text-decoration: none; font-size: 10px; margin: 0;"
>
<img src="https://pikwizard.com/pw/medium/8d65ffd235fc18a9b7db9c3216e7480c.jpg" style="margin: 0; width: 100%;" alt="" />
<p style="font-size: 12px; margin: 0;">PikWizard</p>
</a>
</span>
</span>
Free (free of charge)
Free for personal and commercial use.
Author: Creative Art
Similar Free Stock Images

Premium


Premium


Premium


Premium


Premium


Premium


Premium


Premium


Premium


Premium


Premium


Premium


Premium


Premium


Premium


Premium


Premium


Premium


Premium


Premium


Premium


Premium


Premium


Premium

