- Home >
- Stock Photos >
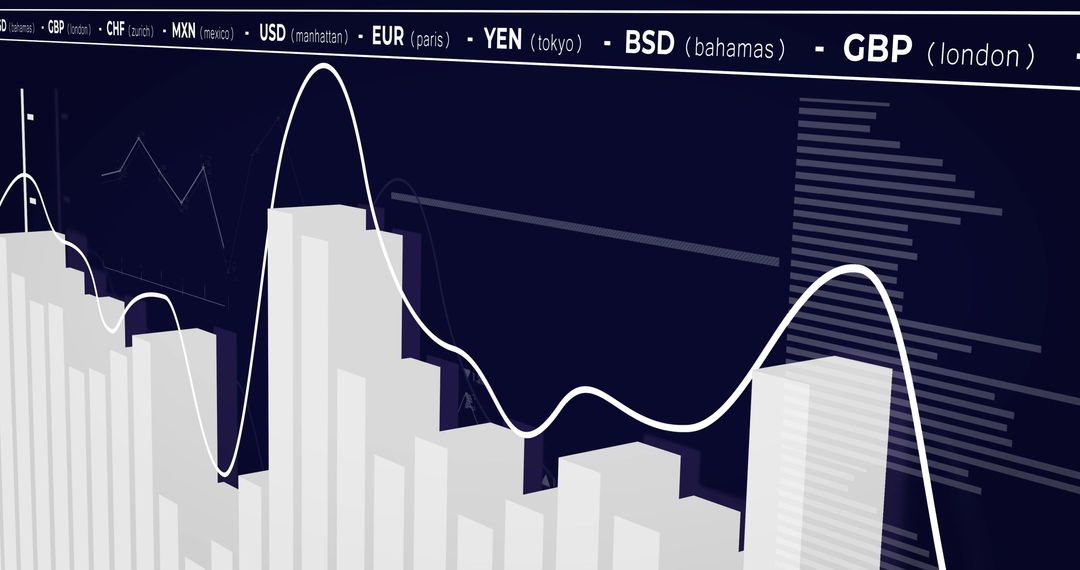
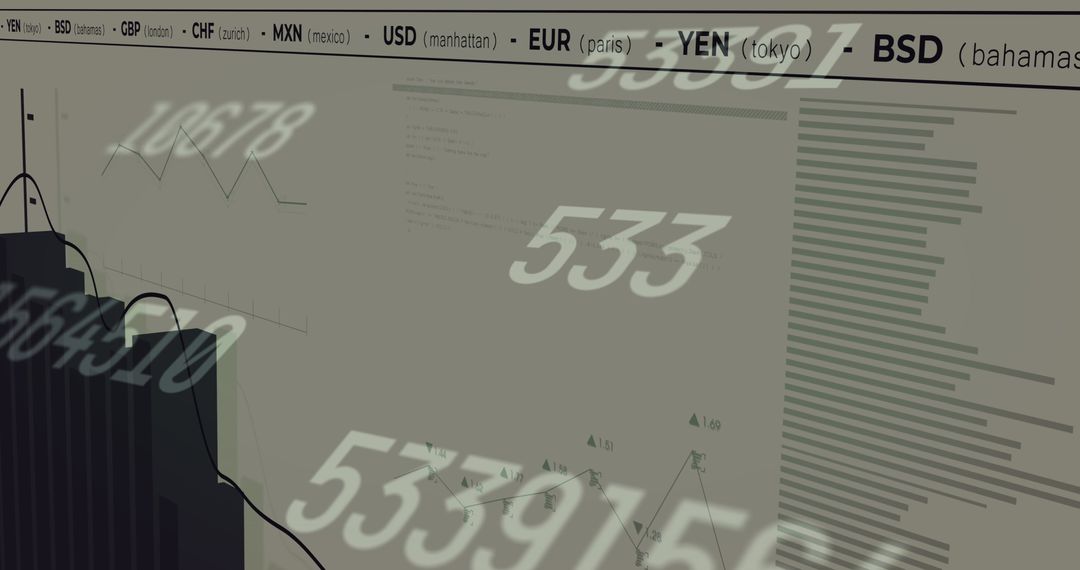
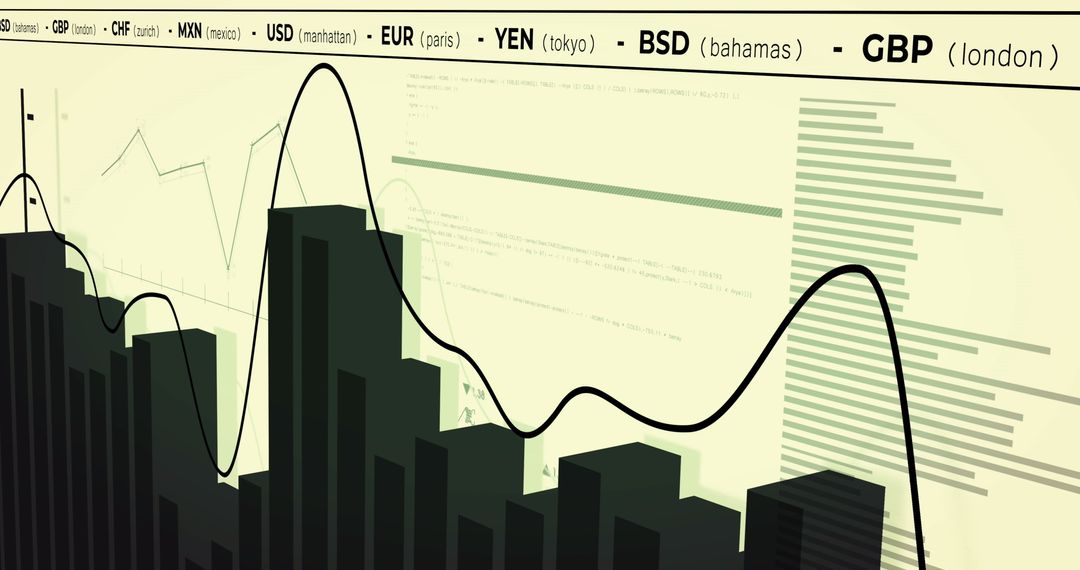
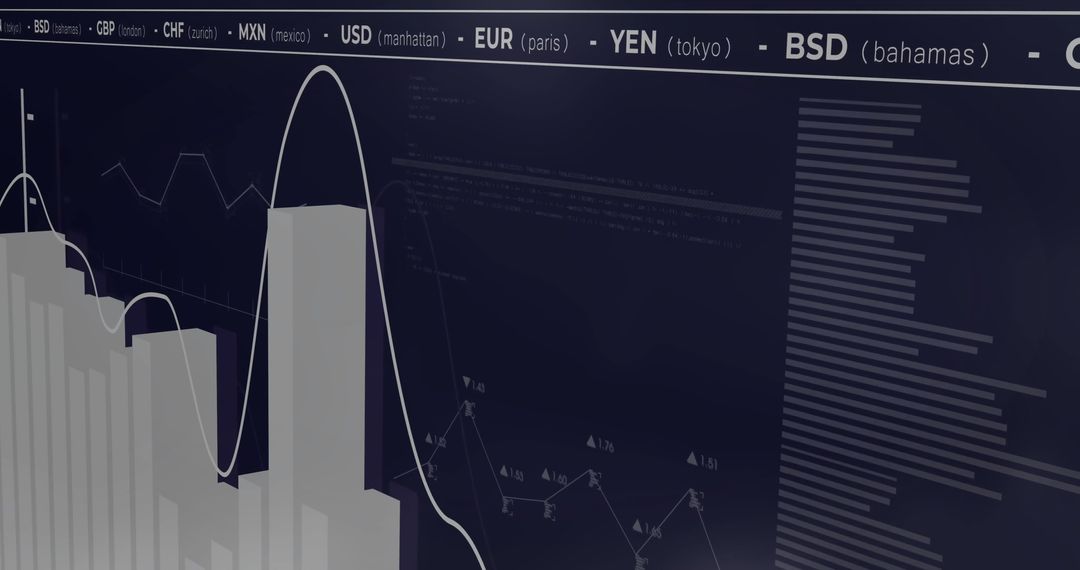
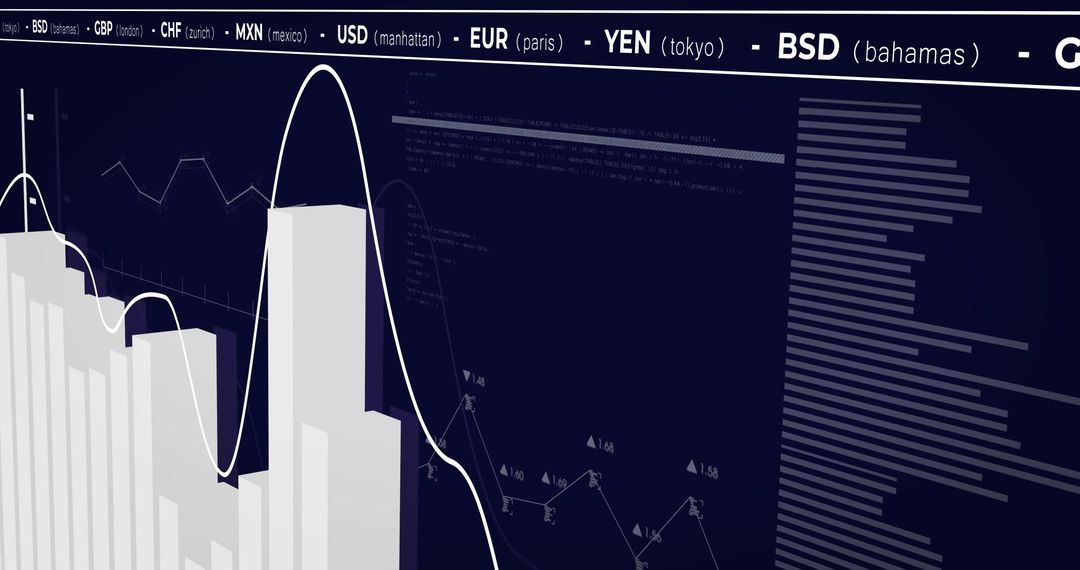
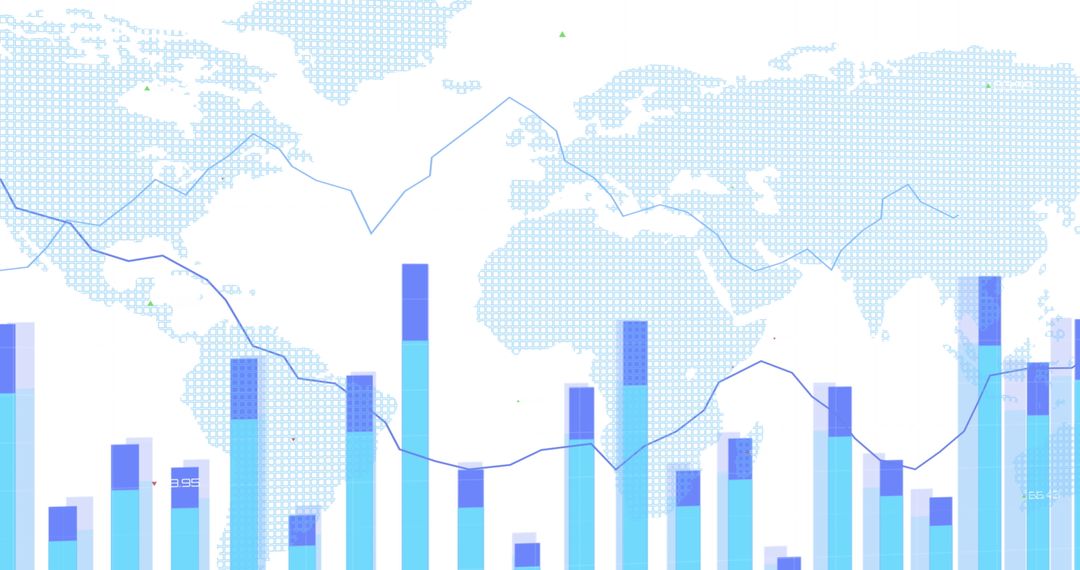
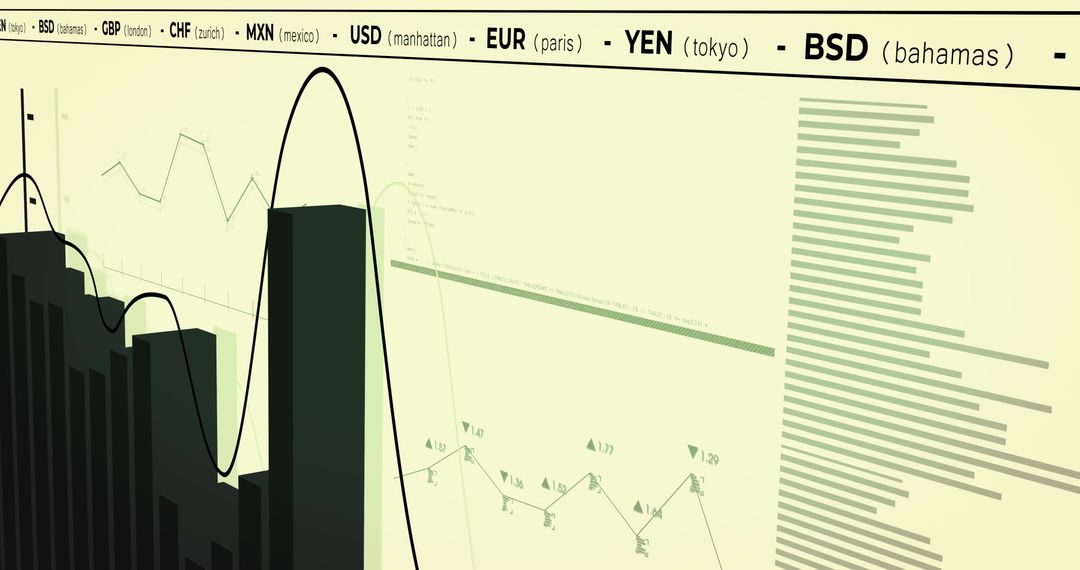
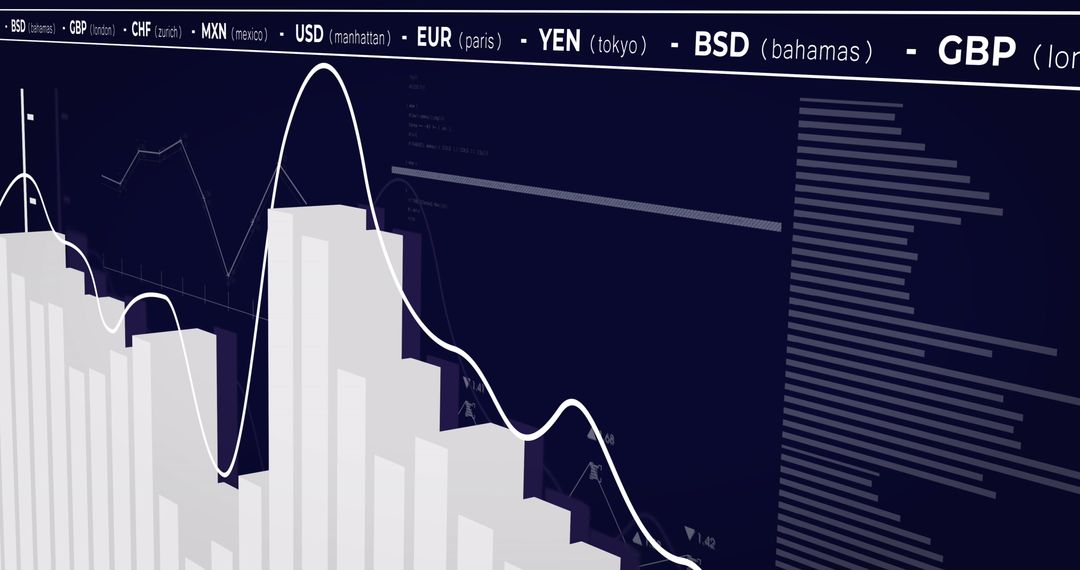
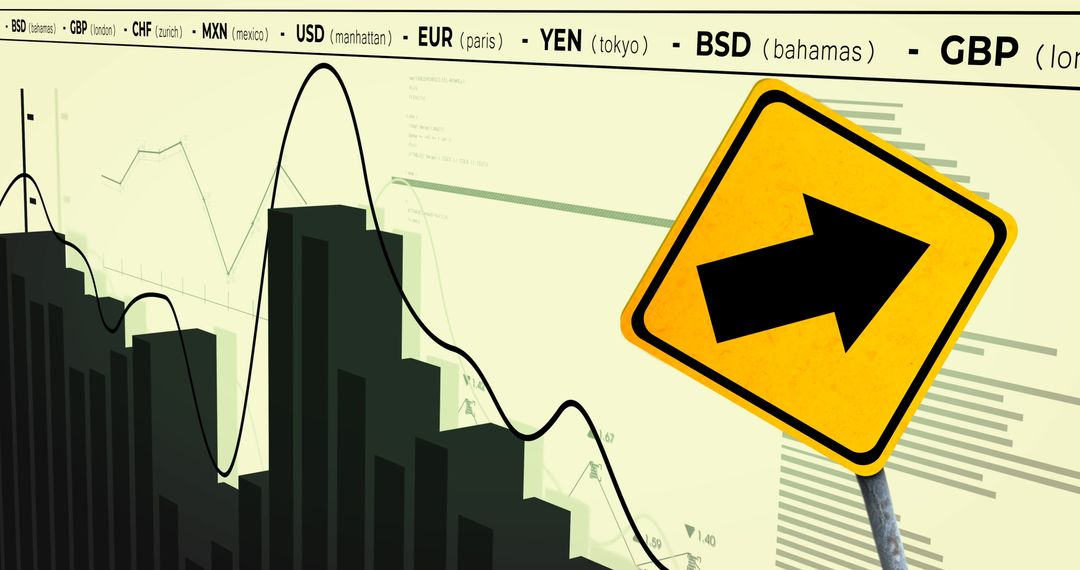
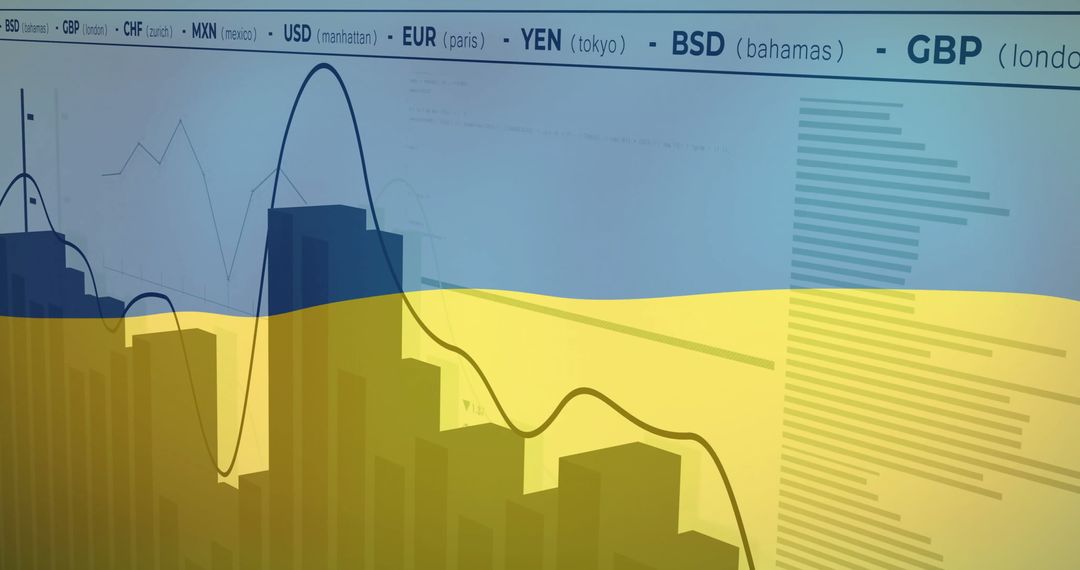
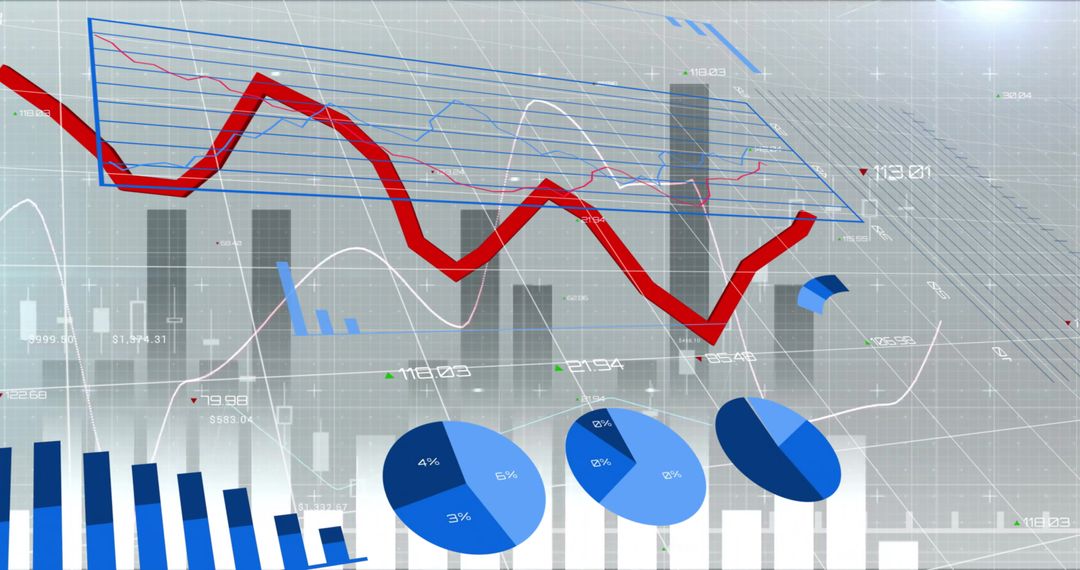
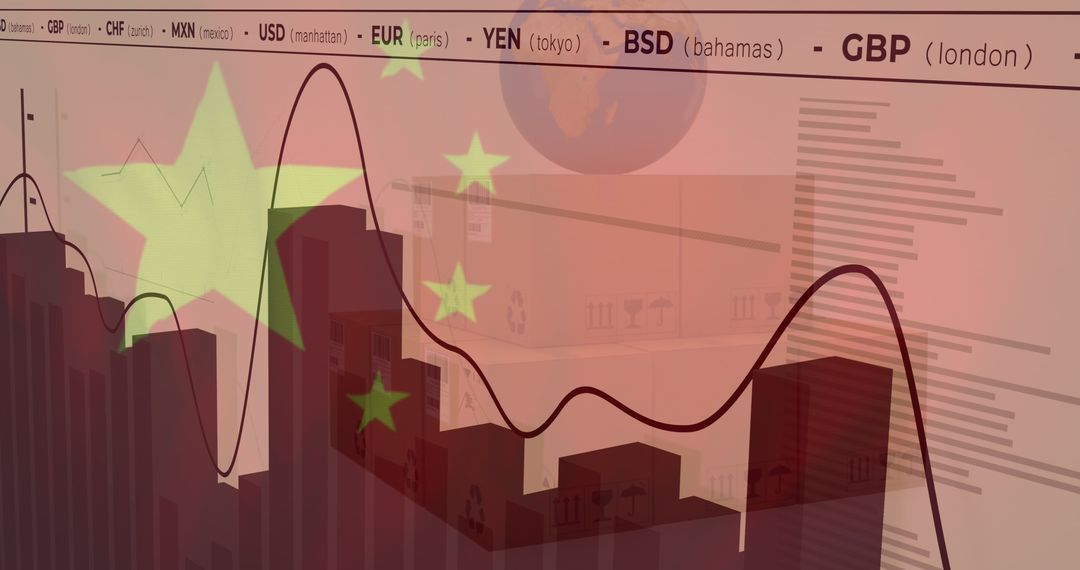
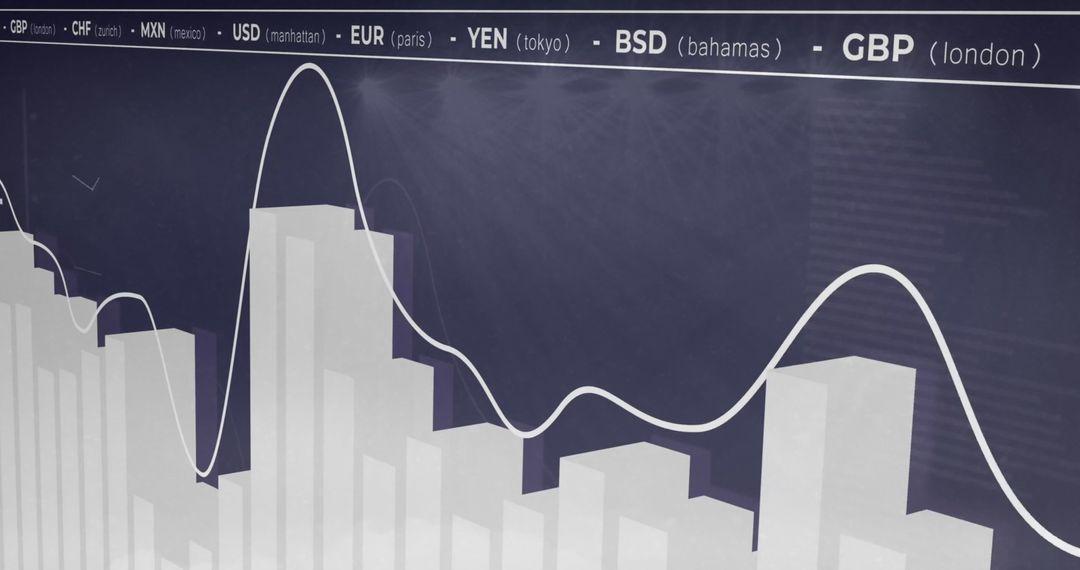
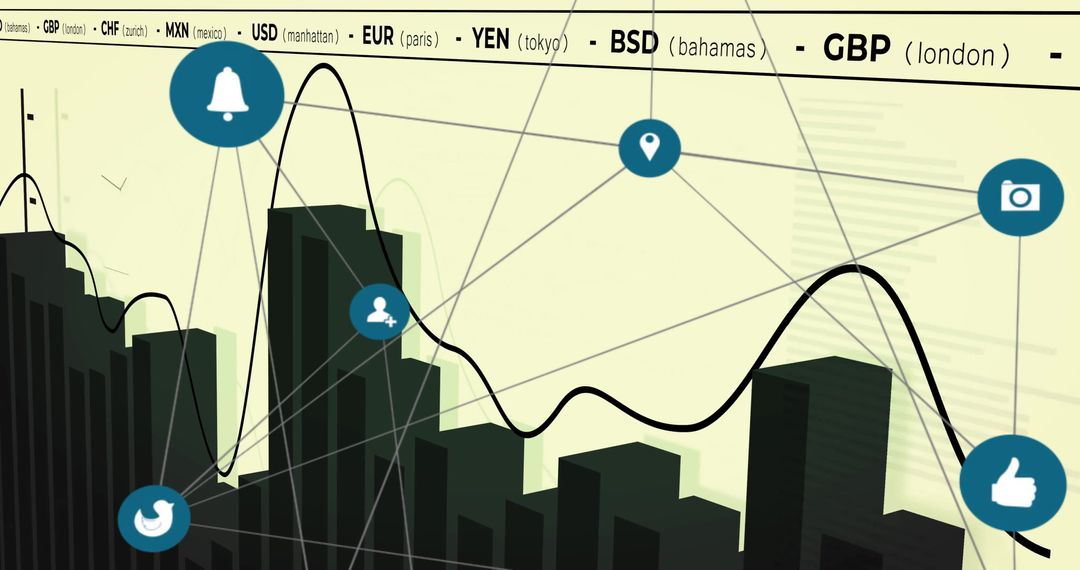
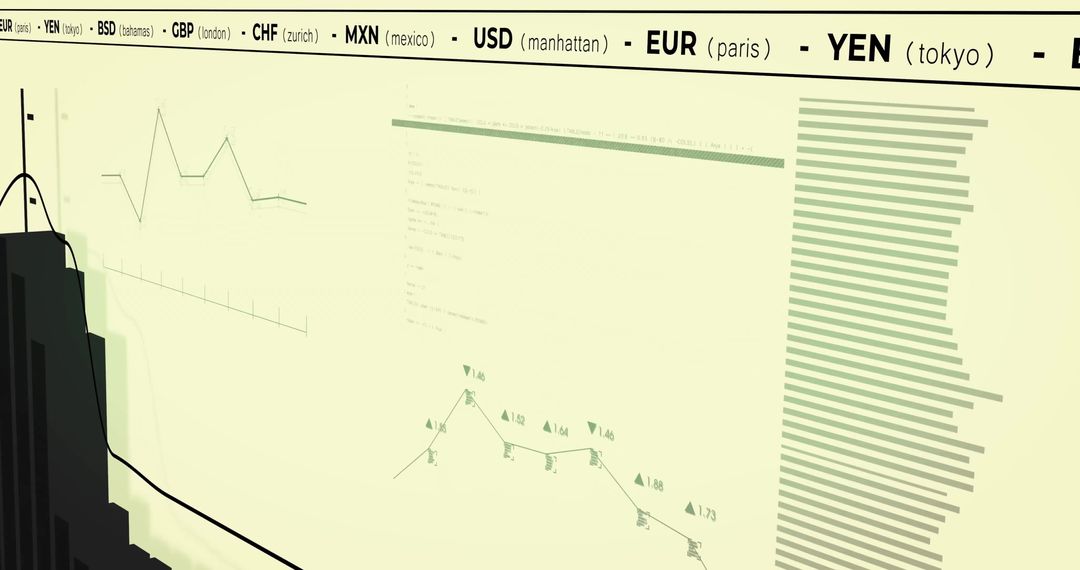
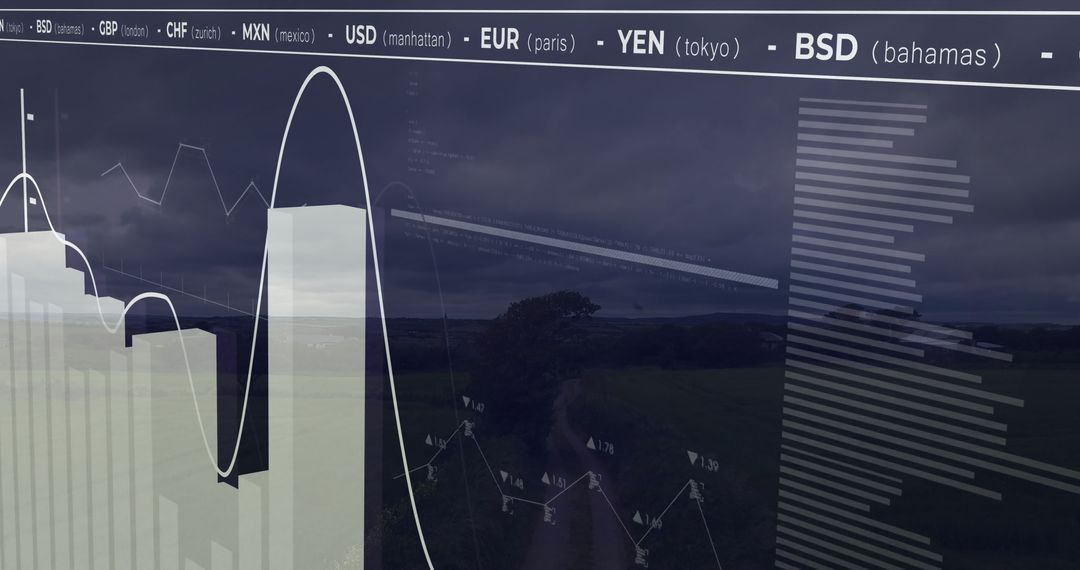
- Global Stock Market and Statistical Data Visualization
Global Stock Market and Statistical Data Visualization Image

Visualization illustrates complex financial data and stock market trends using graphs and charts. Ideal for presentations on global financial market analysis, economic reports, and data-driven decision making. Also useful for educational materials on understanding forex and currency trading dynamics.
Powered by  - Get 15% off with code: PIKWIZARD15


2
downloads
downloads
Tags:
More
Credit Photo
If you would like to credit the Photo, here are some ways you can do so
Text Link
photo Link
<span class="text-link">
<span>
<a target="_blank" href=https://pikwizard.com/photo/global-stock-market-and-statistical-data-visualization/73d808abcf42085e81957b7c5c0e3cc2/>PikWizard</a>
</span>
</span>
<span class="image-link">
<span
style="margin: 0 0 20px 0; display: inline-block; vertical-align: middle; width: 100%;"
>
<a
target="_blank"
href="https://pikwizard.com/photo/global-stock-market-and-statistical-data-visualization/73d808abcf42085e81957b7c5c0e3cc2/"
style="text-decoration: none; font-size: 10px; margin: 0;"
>
<img src="https://pikwizard.com/pw/medium/73d808abcf42085e81957b7c5c0e3cc2.jpg" style="margin: 0; width: 100%;" alt="" />
<p style="font-size: 12px; margin: 0;">PikWizard</p>
</a>
</span>
</span>
Free (free of charge)
Free for personal and commercial use.
Author: Authentic Images
Similar Free Stock Images
Premium


Premium


Premium


Premium


Premium


Premium


Premium


Premium


Premium


Premium


Premium


Premium


Premium


Premium


Premium


Premium


Premium


Premium


Premium


Premium


Premium


Premium


Premium


Premium