
- Home >
- Stock Photos >
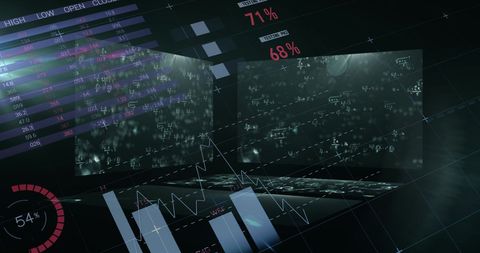
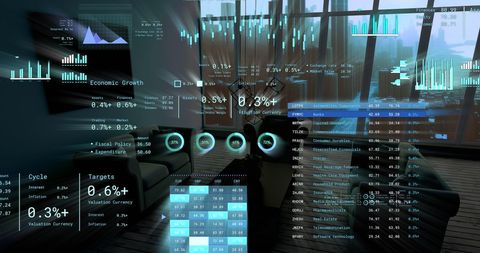
- Global Stock Market Data in High-Tech Server Room Visualization
Global Stock Market Data in High-Tech Server Room Visualization Image

Digital composite of graphs and globe overlay on a high-tech data center background illustrates the global aspect of trading and financial data analysis. Useful for publications or presentations on globalization, technology advancements, and modern financial systems. Ideal for articles discussing trends in global stock markets or future of networked data management.
Powered by  - Get 15% off with code: PIKWIZARD15


downloads
Tags:
More
Credit Photo
If you would like to credit the Photo, here are some ways you can do so
Text Link
photo Link
<span class="text-link">
<span>
<a target="_blank" href=https://pikwizard.com/photo/global-stock-market-data-in-high-tech-server-room-visualization/d9cc8dc2ffe8ef48b3e1d19b209ffcb8/>PikWizard</a>
</span>
</span>
<span class="image-link">
<span
style="margin: 0 0 20px 0; display: inline-block; vertical-align: middle; width: 100%;"
>
<a
target="_blank"
href="https://pikwizard.com/photo/global-stock-market-data-in-high-tech-server-room-visualization/d9cc8dc2ffe8ef48b3e1d19b209ffcb8/"
style="text-decoration: none; font-size: 10px; margin: 0;"
>
<img src="https://pikwizard.com/pw/medium/d9cc8dc2ffe8ef48b3e1d19b209ffcb8.jpg" style="margin: 0; width: 100%;" alt="" />
<p style="font-size: 12px; margin: 0;">PikWizard</p>
</a>
</span>
</span>
Free (free of charge)
Free for personal and commercial use.
Author: Creative Art
Similar Free Stock Images

Premium


Premium


Premium


Premium


Premium


Premium


Premium


Premium


Premium


Premium

Premium

Premium


Premium


Premium


Premium


Premium


Premium


Premium


Premium

Premium


Premium


Premium


Premium

Premium

Premium

Explore More Free Stock Images