- Home >
- Stock Photos >
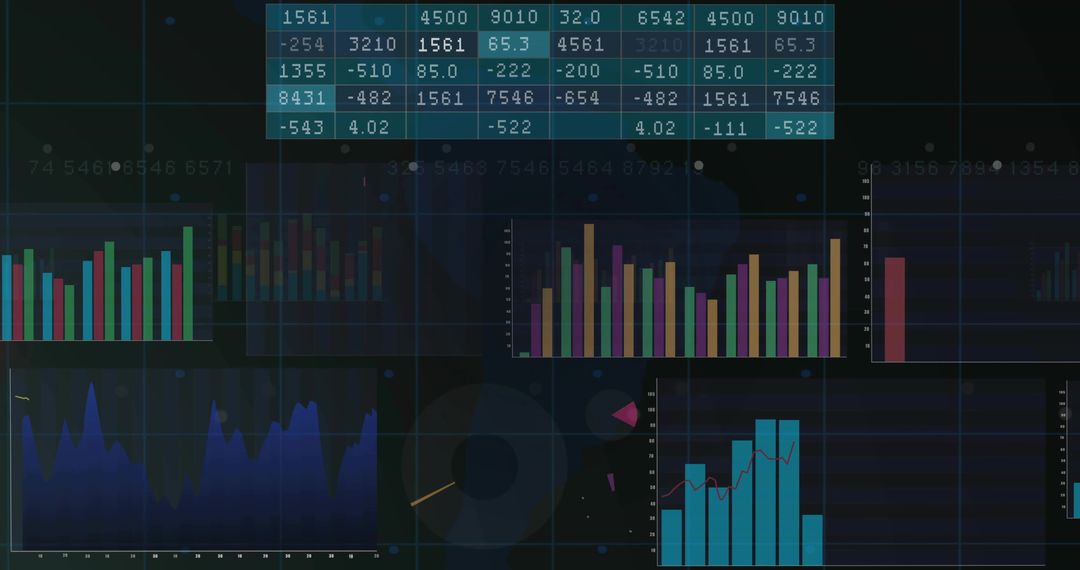
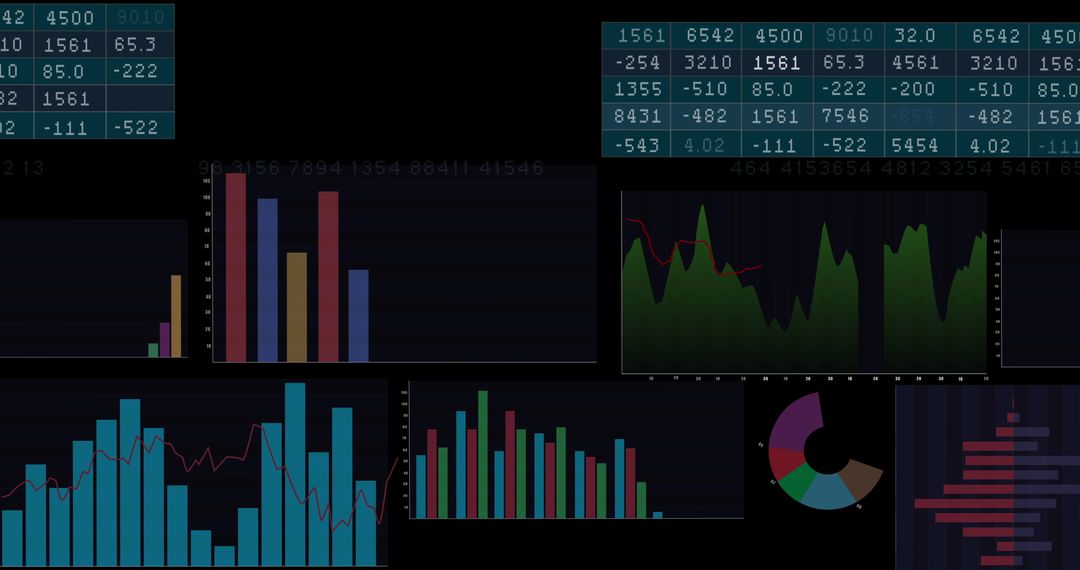
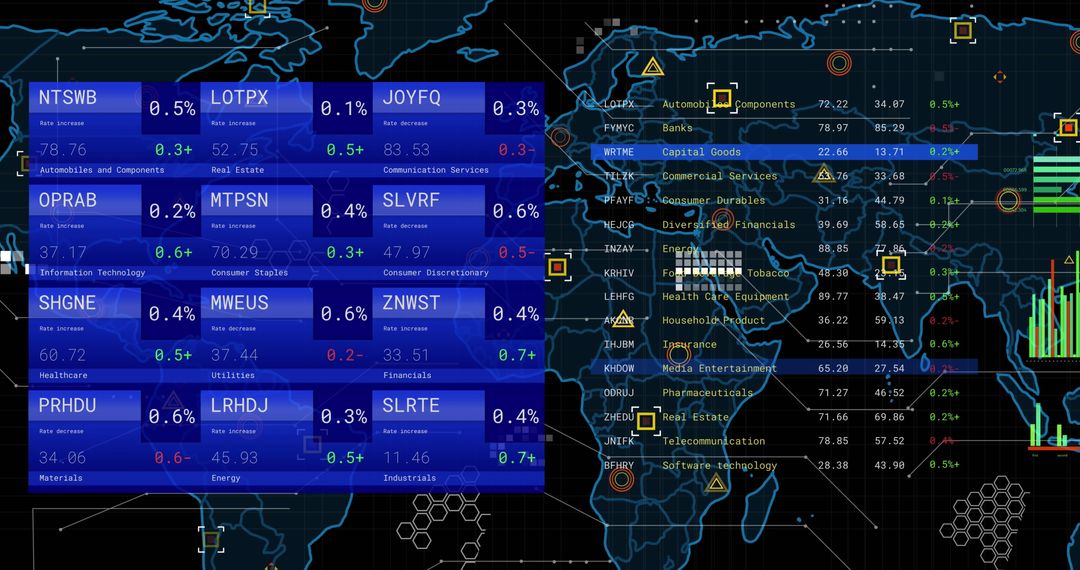
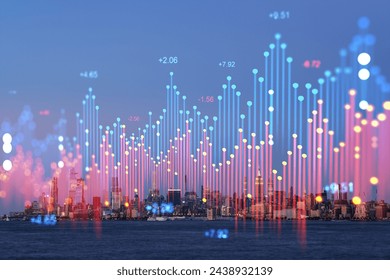
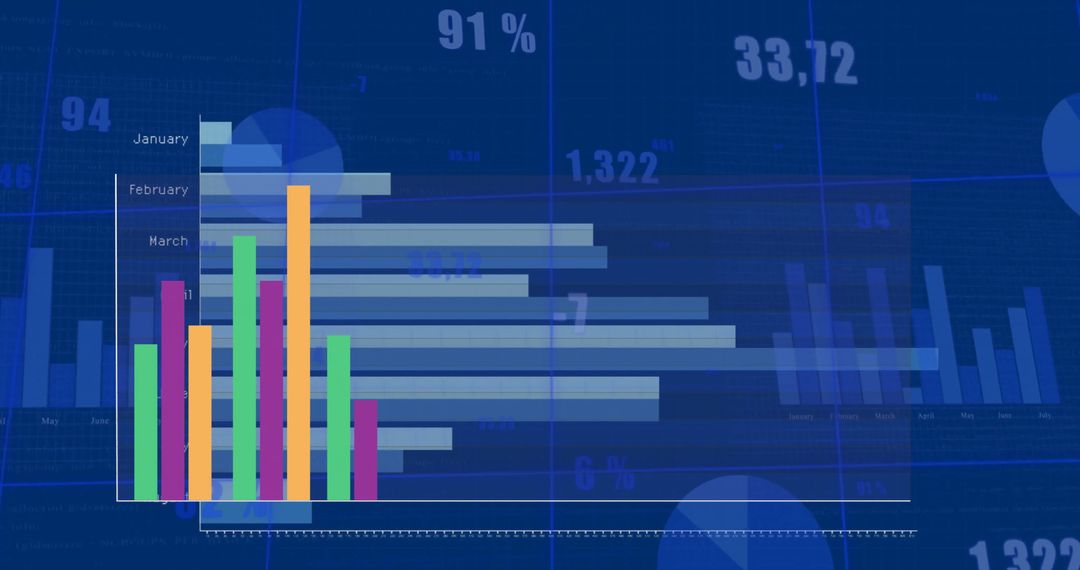
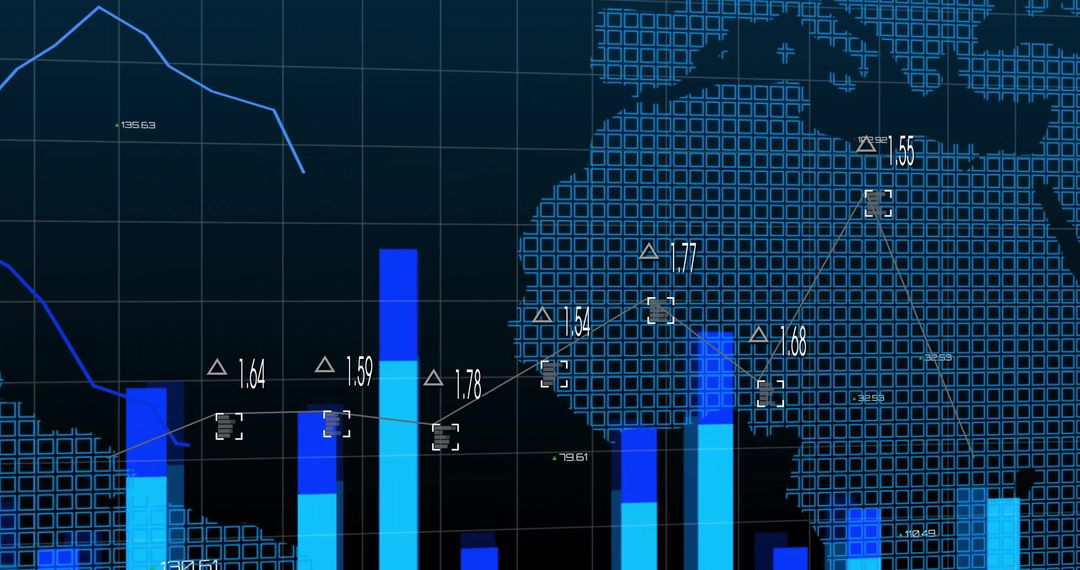
- Global Stock Market Data Overlay with Charts and World Map
Global Stock Market Data Overlay with Charts and World Map Image

Visual depicts digital representation of global financial data with colorful graphs and numerical data laid against world map outlines. Reflects the concept of global financial markets, combining advanced technology with investment analytics. Suitable for use in finance-related presentations, articles about global markets, economic applications showing market trends, or educational materials discussing financial analysis and technology impacts.
Powered by  - Get 15% off with code: PIKWIZARD15


2
downloads
downloads
Tags:
More
Credit Photo
If you would like to credit the Photo, here are some ways you can do so
Text Link
photo Link
<span class="text-link">
<span>
<a target="_blank" href=https://pikwizard.com/photo/global-stock-market-data-overlay-with-charts-and-world-map/25dc1256f67a7099a97430b6e57ab3d3/>PikWizard</a>
</span>
</span>
<span class="image-link">
<span
style="margin: 0 0 20px 0; display: inline-block; vertical-align: middle; width: 100%;"
>
<a
target="_blank"
href="https://pikwizard.com/photo/global-stock-market-data-overlay-with-charts-and-world-map/25dc1256f67a7099a97430b6e57ab3d3/"
style="text-decoration: none; font-size: 10px; margin: 0;"
>
<img src="https://pikwizard.com/pw/medium/25dc1256f67a7099a97430b6e57ab3d3.jpg" style="margin: 0; width: 100%;" alt="" />
<p style="font-size: 12px; margin: 0;">PikWizard</p>
</a>
</span>
</span>
Free (free of charge)
Free for personal and commercial use.
Author: Awesome Content
Similar Free Stock Images

Premium


Premium


Premium


Premium


Premium


Premium


Premium


Premium


Premium


Premium


Premium


Premium


Premium


Premium


Premium


Premium


Premium


Premium


Premium


Premium


Premium


Premium


Premium


Premium