- Home >
- Stock Photos >
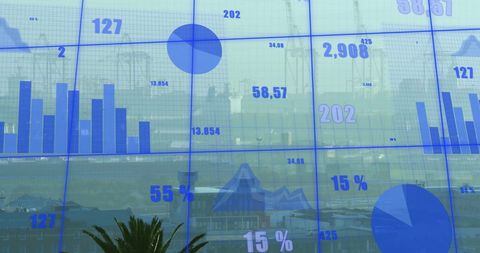
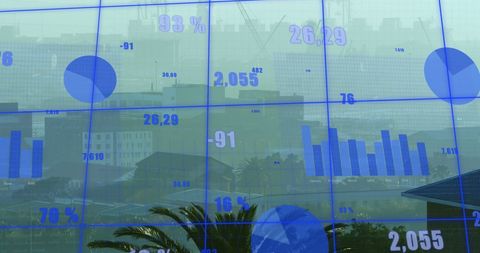
- Global Stock Market Data Visualization on World Map Background
Global Stock Market Data Visualization on World Map Background Image

Global-oriented financial visual blending stock market stats with world map in a digital style. Ideal for presentations on worldwide financial trends, economic reports, or investment promotions. Useful for illustrating global business strategies, fintech innovations, or the impact of market movements.
Powered by  - Get 15% off with code: PIKWIZARD15


2
downloads
downloads
Tags:
More
Credit Photo
If you would like to credit the Photo, here are some ways you can do so
Text Link
photo Link
<span class="text-link">
<span>
<a target="_blank" href=https://pikwizard.com/photo/global-stock-market-data-visualization-on-world-map-background/a3c77969bed52188238924ed6cb5d392/>PikWizard</a>
</span>
</span>
<span class="image-link">
<span
style="margin: 0 0 20px 0; display: inline-block; vertical-align: middle; width: 100%;"
>
<a
target="_blank"
href="https://pikwizard.com/photo/global-stock-market-data-visualization-on-world-map-background/a3c77969bed52188238924ed6cb5d392/"
style="text-decoration: none; font-size: 10px; margin: 0;"
>
<img src="https://pikwizard.com/pw/medium/a3c77969bed52188238924ed6cb5d392.jpg" style="margin: 0; width: 100%;" alt="" />
<p style="font-size: 12px; margin: 0;">PikWizard</p>
</a>
</span>
</span>
Free (free of charge)
Free for personal and commercial use.
Author: People Creations
Similar Free Stock Images
Loading...

Premium


Premium


Premium


Premium

Premium


Premium

Premium


Premium


Premium


Premium


Premium

Premium

Premium


Premium


Premium

Premium


Premium


Premium

Premium


Premium


Premium


Premium


Premium


Premium


Premium